

Has Walmart (WMT) Run Too Far After Its 23.5% One Year Share Price Gain
Walmart Inc. WMT | 0.00 |
- Considering whether Walmart's share price still offers value after a strong run, or if most of the potential upside is already reflected in the stock.
- Over the last year the stock has returned 23.5%, with a gain of 5.4% year to date. This follows a decline of 2.0% over the past week and 6.8% over the past month from a recent close of US$118.90.
- Recent attention on Walmart has focused on its position in US consumer retail and how its scale, store network, and online presence may be influencing expectations around future cash flows and competitive resilience. Investors have also been weighing how these business characteristics could affect the stock's risk profile as sentiment shifts across consumer and e-commerce companies.
- Simply Wall St currently assigns Walmart a value score of 1 out of 6. The rest of this article will unpack what that means by comparing different valuation approaches, then conclude with a broader way to think about what the numbers might be missing.
Walmart scores just 1/6 on our valuation checks. See what other red flags we found in the full valuation breakdown.
Approach 1: Walmart Discounted Cash Flow (DCF) Analysis
A Discounted Cash Flow model estimates what a stock could be worth by projecting future cash flows and discounting them back to today, so you are comparing like for like in today’s dollars.
For Walmart, the model uses a 2 Stage Free Cash Flow to Equity approach. The latest twelve month free cash flow is about $15.2b. Analysts provide cash flow estimates out to 2029, then Simply Wall St extrapolates further, with projected free cash flow of $23.8b in 2030 and continuing projections through 2035.
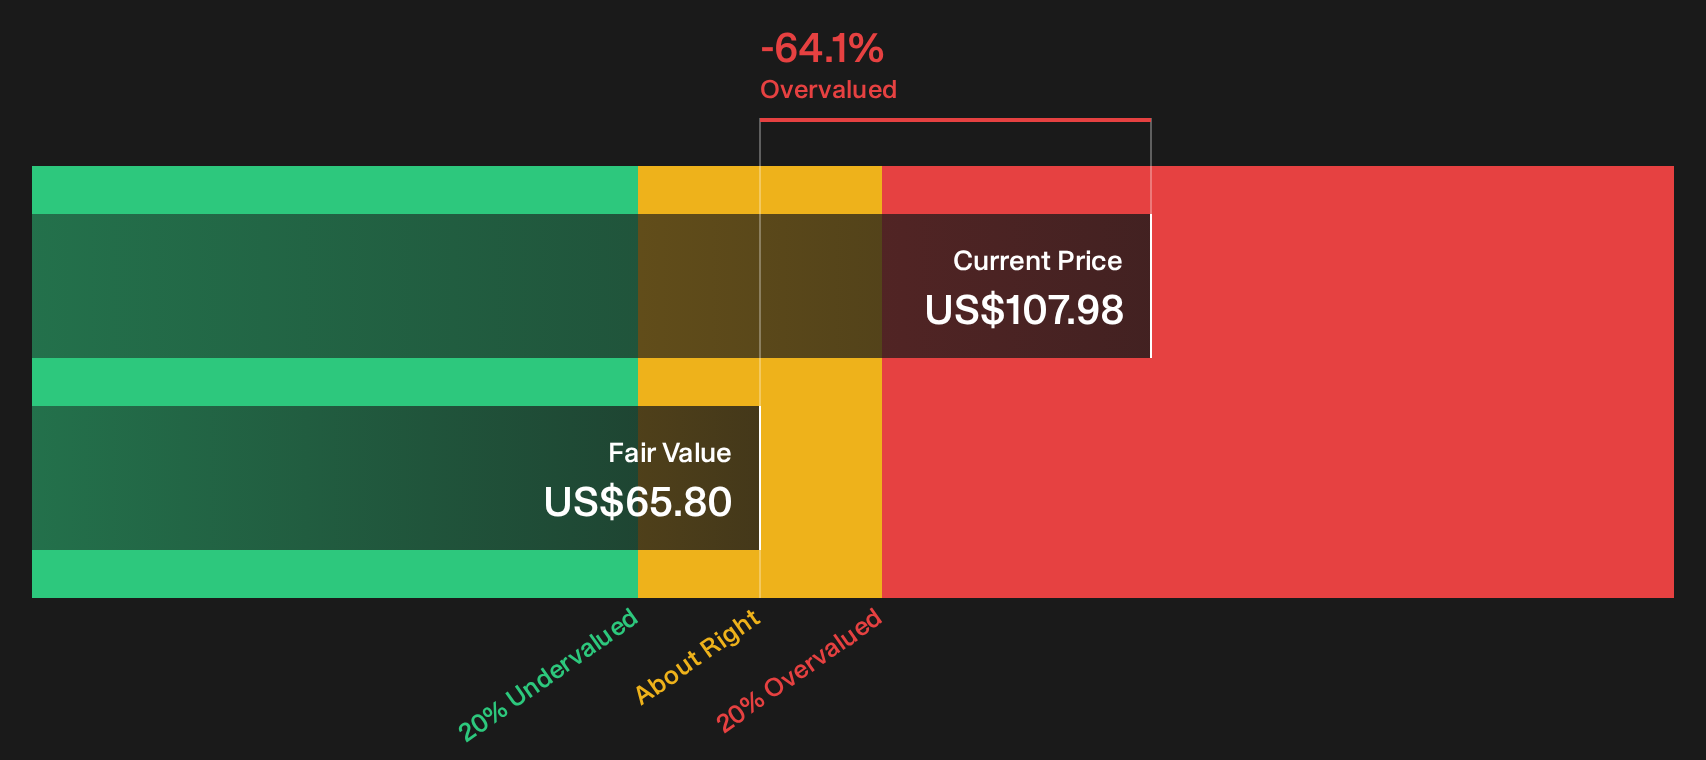
Bringing all those projected cash flows back to today results in an estimated intrinsic value of $91.69 per share. Compared to the recent share price of $118.90, the DCF output implies the stock is about 29.7% above this intrinsic value estimate, so on this model Walmart screens as expensive rather than cheap.
Result: OVERVALUED
Our Discounted Cash Flow (DCF) analysis suggests Walmart may be overvalued by 29.7%. Discover 46 high quality undervalued stocks or create your own screener to find better value opportunities.
Approach 2: Walmart Price vs Earnings (P/E)
For a profitable company like Walmart, the P/E ratio is a useful way to see how much you are paying for each dollar of earnings. Investors usually accept a higher P/E if they expect stronger earnings growth or see the stock as lower risk, and a lower P/E if they expect slower growth or see higher risk.
Walmart currently trades on a P/E of 41.7x. That is higher than the Consumer Retailing industry average of 18.7x and above the peer group average of 25.5x, so the stock is priced at a premium compared with many listed retailers. On its own, that premium does not say whether the stock is too expensive, because it does not adjust for Walmart's specific growth profile, margins, size and risk.
Simply Wall St's Fair Ratio for Walmart is 44.3x. This proprietary metric estimates what a P/E could look like after accounting for factors such as earnings growth, industry, profit margins, market cap and risk, which makes it more tailored than a simple comparison with peers or industry averages. Since the Fair Ratio of 44.3x is above the current 41.7x, Walmart screens as somewhat undervalued on this metric.
Result: UNDERVALUED

P/E ratios tell one story, but what if the real opportunity lies elsewhere? Start investing in legacies, not executives. Discover our 21 top founder-led companies.
Upgrade Your Decision Making: Choose your Walmart Narrative
Earlier it was mentioned that there is an even better way to understand valuation. This is where Narratives come in as a simple way for you to attach a clear story about Walmart to your numbers, linking your assumptions for future revenue, earnings and margins to a fair value and then comparing that to today’s price.
A Narrative on Simply Wall St is your structured view of a company that connects the business story, a financial forecast and an estimated fair value in one place. Instead of just looking at a P/E ratio, you see how the story you believe in flows through to cash flows, earnings and valuation.
You can create and explore Narratives for Walmart directly inside the Community page on Simply Wall St, which is used by millions of investors. These Narratives are updated automatically when new information such as earnings releases or news is added, so your fair value estimate keeps reflecting the latest data without extra work from you.
For Walmart, one investor might build a Narrative similar to the higher analyst and community views, assuming revenue around US$835.7b in 2029, a net profit of about US$33.4b and a future P/E close to 46.9x. A more cautious investor might lean toward the lower side of the analyst range with earnings around US$28.4b, a fair value near US$71.7 to US$74.67 per share and a future P/E closer to 22x to 23x. By comparing each Narrative’s Fair Value with the current share price, you get a clearer sense of whether your own story is pointing to the stock as expensive or cheap for you personally.
For Walmart, however, we’ll make it really easy for you with previews of two leading Walmart Narratives:
Each one connects a clear story about the business to a specific fair value, so you can quickly see which feels closer to your own view on the stock.
Fair value in this Bull Narrative: US$136.56 per share
Gap to this fair value vs the recent price of US$118.90: the stock sits about 12.9% below the narrative fair value, so this author sees upside to close that gap.
Revenue growth assumption: 4.76% a year
- Focuses on Walmart leaning into omni channel retail, rapid delivery and AI in areas like logistics, personalization and inventory to support revenue and margin expansion.
- Highlights the growing role of higher margin activities such as advertising through Walmart Connect, memberships and marketplace services, along with contributions from international markets including China, Mexico and India.
- Points out risks from tariffs, wage and claims cost inflation, competitive pressure in grocery and e commerce, and execution challenges in international markets that could limit profitability if not well managed.
Fair value in this Bear Narrative: US$71.70 per share
Gap to this fair value vs the recent price of US$118.90: the stock trades about 65.8% above the narrative fair value, so this author sees the current price as rich relative to their assumptions.
Revenue growth assumption: 4.40% a year
- Emphasizes Walmart’s scale, supply chain and cost control, but pairs that with the view that even with automation, e commerce and international growth, margins and returns may not justify a much higher valuation multiple.
- Sees long term value coming from automation, cloud and tech investments plus international expansion, yet still anchors on a lower future P/E of 22x and a fair value that sits well below the current share price.
- Flags risks including rising labor costs, execution and political risks around China and India, intense competition from Amazon, Target and Costco, supply chain vulnerabilities and insider selling over the past year.
If you want to see how other investors are joining the dots between these types of stories and their own fair values, there is a full set of Walmart Narratives and valuation tools on Simply Wall St that you can use as a reference point while building your own view. To see how these results tie into long-term growth, risks, and valuation, check out the full range of community narratives for Walmart on Simply Wall St. Add the company to your watchlist or portfolio so you'll be alerted when the story evolves.
Do you think there's more to the story for Walmart? Head over to our Community to see what others are saying!

This article by Simply Wall St is general in nature. We provide commentary based on historical data and analyst forecasts only using an unbiased methodology and our articles are not intended to be financial advice. It does not constitute a recommendation to buy or sell any stock, and does not take account of your objectives, or your financial situation. We aim to bring you long-term focused analysis driven by fundamental data. Note that our analysis may not factor in the latest price-sensitive company announcements or qualitative material. Simply Wall St has no position in any stocks mentioned.