How HP’s Share Price Looks After the Poly Acquisition Integration in 2025
HP Inc. HPQ | 0.00 |
If you are on the fence about what to do with HP stock right now, you're definitely not alone. Plenty of investors are taking a closer look after seeing the stock close at $27.97, with movements that have made for an interesting ride. In just the past week, HP slid by 4.7%. Zoom out a little and the picture changes, with a 4.6% gain over the last month. Year to date, it is still down 13.9%, and even the last twelve months show a 13.8% drop. Step back a few years, and you'll see an entirely different story, as HP is up 15.8% over the last three years and a striking 80.1% over five years. These shifts reflect not just broader market waves, but also a refresh in how Wall Street perceives HP's growth potential and risks, particularly as the technology landscape keeps evolving.
So, is HP undervalued, fairly priced, or something in between? According to our multi-pronged valuation review, HP scores 5 out of 6 on the undervaluation checklist, putting it firmly in the “potentially overlooked” category. Of course, not every valuation method tells the same story. That is exactly what we'll unpack next. If you think you already know all the ways to value a company, you might be surprised by what we uncover by the end.
Why HP is lagging behind its peersApproach 1: HP Discounted Cash Flow (DCF) Analysis
A Discounted Cash Flow (DCF) model estimates a company's intrinsic value by projecting its future cash flows and discounting them back to today's dollars. This approach is favored for its focus on cash generation rather than accounting profits or book values, making it particularly useful for evaluating companies with steady free cash flow.
For HP, the latest reported Free Cash Flow stands at $3.01 Billion. The model utilizes both analyst estimates and longer-term projections to look as far as the next decade. Analysts forecast gradual growth in annual free cash flows, rising to $3.62 Billion in 2026. Extrapolated data then projects a fairly steady trajectory, reaching about $3.56 Billion by 2035. These projections reflect methodical growth assumptions, with Simply Wall St extending the analyst horizon forward using modest rates drawn from recent trends and sector insights.
Based on this future cash flow profile, the DCF model calculates an intrinsic fair value for HP of $50.89 per share. Given that HP's current share price is $27.97, the implied discount is a substantial 45.0%. This suggests the stock is deeply undervalued relative to its forecasted ability to generate cash in the years ahead.
Result: UNDERVALUED
Head to the Valuation section of our Company Report for more details on how we arrive at this Fair Value for HP.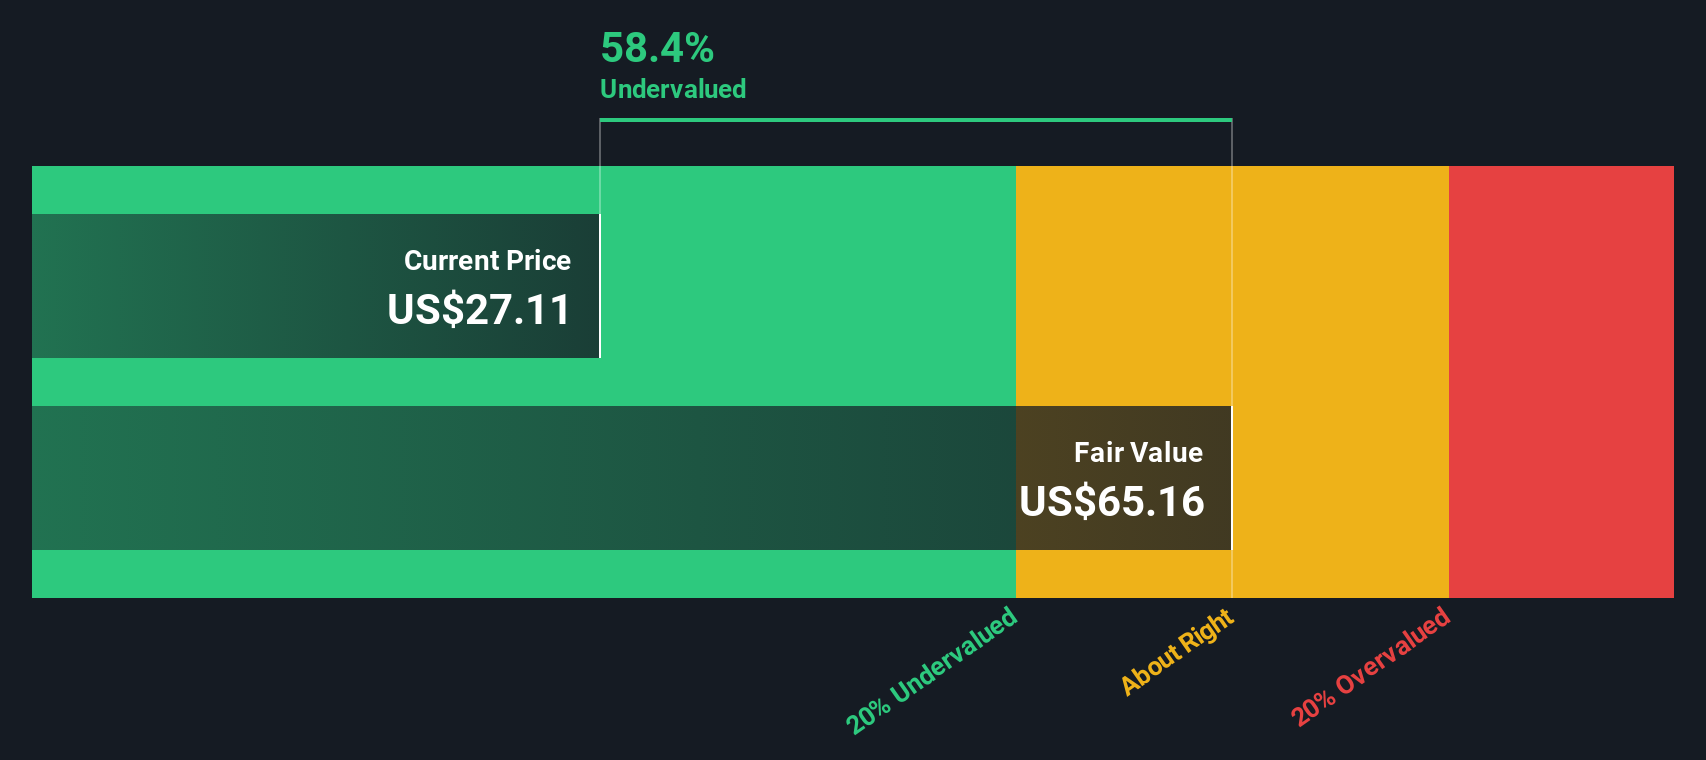
Approach 2: HP Price vs Earnings (PE Ratio)
The Price-to-Earnings (PE) ratio is one of the most common ways to value profitable companies because it quickly reflects how much investors are willing to pay today for a dollar of current earnings. For firms with a solid earnings base, the PE ratio offers a clear, apples-to-apples way to compare value across companies in the same industry or market.
Growth expectations and risk play a huge role in what counts as a “normal” or “fair” PE ratio. Companies expecting strong profit growth or with relatively low risks generally command higher PE ratios, since investors are willing to pay more for the promise of future gains. On the other hand, slower growth or higher uncertainty usually means a lower PE makes sense.
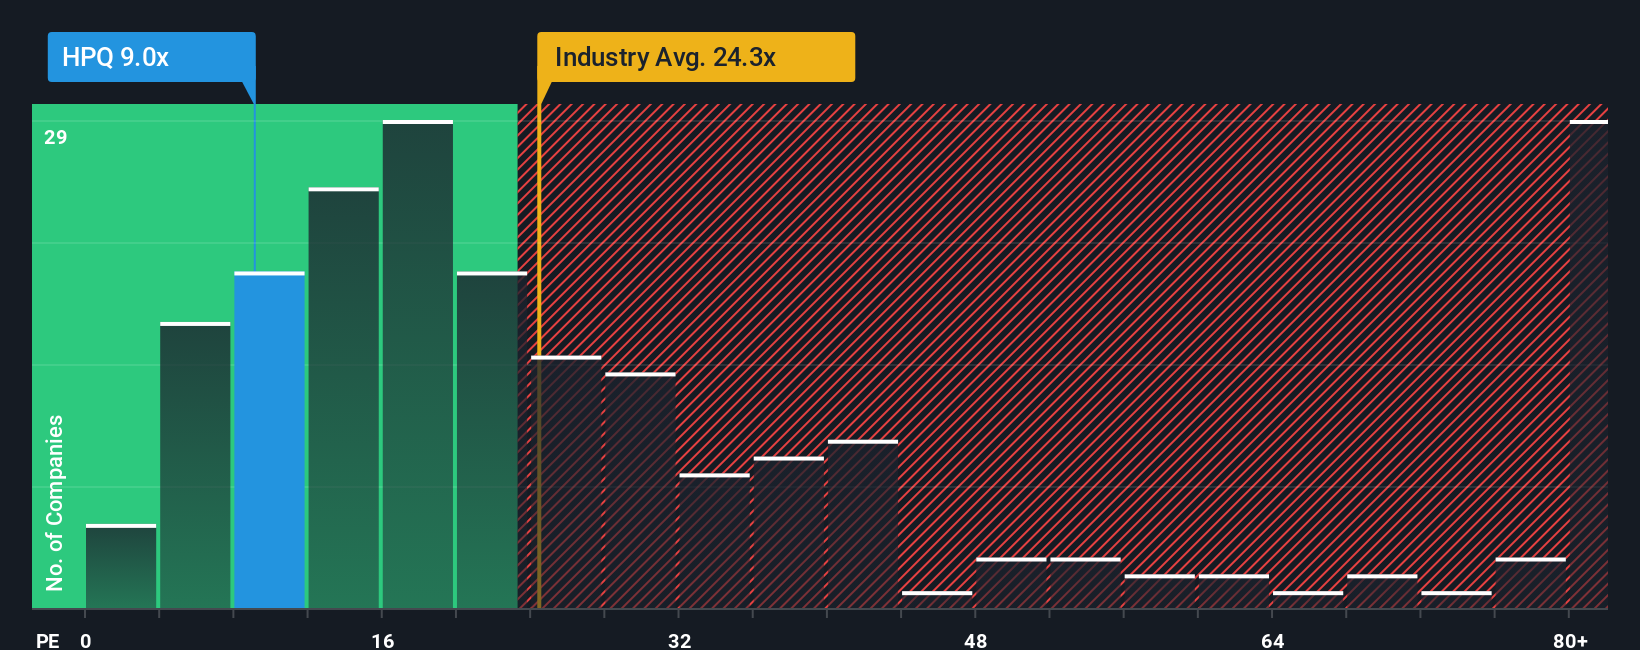
Right now, HP trades at a PE ratio of 9.9x. To put that in perspective, the industry average is 23.9x, while close peers sit even higher at 66.3x. On the surface, HP looks far cheaper than both its direct competition and the broader sector.
However, instead of relying solely on those typical benchmarks, Simply Wall St’s proprietary “Fair Ratio” takes a deeper look. It uses factors like HP’s earnings growth, profit margins, size, risk profile, and even its industry to calculate a more nuanced valuation multiple. For HP, the Fair Ratio comes in at 24.6x, suggesting the kind of PE ratio HP would deserve based on its overall financial outlook and risk landscape.
Because the Fair Ratio accounts for HP’s individual strengths and vulnerabilities, it gives a more realistic target than simply comparing HP to its sector or its peers. In this case, HP’s actual PE of 9.9x is well below the Fair Ratio of 24.6x. This could indicate the market may be significantly undervaluing the stock’s true earnings power.
Result: UNDERVALUED
Upgrade Your Decision Making: Choose your HP Narrative
Earlier we mentioned a better way to understand valuation, so let's introduce you to Narratives. A Narrative is your personal story about a company's future, weaving together your own perspective with the company's potential financial performance. For example, what you believe HP's upcoming revenue, margins, and fair value will be, and why. Narratives connect the dots between a company's story, your forecast of key metrics, and a resulting estimate of fair value, making investing less about formulas and more about your conviction.
On Simply Wall St's Community page, millions of investors use Narratives as an easy, dynamic tool to track, adjust, and learn from real-time news and company developments. Narratives help you decide when to buy or sell by letting you compare your fair value directly to the current share price. As new information comes in, such as earnings updates or business announcements, your Narrative and its fair value estimate are automatically refreshed, keeping your thinking up to date.
For instance, when it comes to HP, some investors in the Community see bright prospects ahead, with fair values near $30 thanks to momentum in AI-powered devices and digital services. Others, more cautious, peg fair value closer to $25 due to competition and declining markets. With Narratives, you do not just follow the numbers, you make them tell your story.
Do you think there's more to the story for HP? Create your own Narrative to let the Community know!
This article by Simply Wall St is general in nature. We provide commentary based on historical data and analyst forecasts only using an unbiased methodology and our articles are not intended to be financial advice. It does not constitute a recommendation to buy or sell any stock, and does not take account of your objectives, or your financial situation. We aim to bring you long-term focused analysis driven by fundamental data. Note that our analysis may not factor in the latest price-sensitive company announcements or qualitative material. Simply Wall St has no position in any stocks mentioned.