How to Trade Gold Seasonality: A Profitable Strategy Based On 20 Years Of Historical Data
In this article, we'll explore seasonality in the financial markets. Seasonality refers to specific time windows throughout the year that are linked to recurring market behaviors, patterns that tend to repeat regularly over time.
Seasonality is typically more relevant in the commodities market, where intrinsic factors like weather patterns and the cyclical nature of supply and demand across different months of the year play a key role. In this case, we'll focus on gold futures (@GC), the quintessential precious metal and undoubtedly one of the most significant markets globally, second only to equities.
Gold Seasonality Explained: Yearly Patterns Revealed by 20+ Years of Data
To analyze seasonality, we'll use Bias Finder, a proprietary software designed to identify recurring patterns in historical data. This tool is particularly effective, offering detailed insights into market dynamics across various timeframes from intraday to yearly views.
Since our objective is to study long-term movements in gold futures, we'll focus on the Yearly analysis, aiming to identify potentially favorable time windows for trading. For this purpose, we'll rely on a large historical dataset spanning from 2003 to the present, more than 20 years of data.
By examining the results shown in Figure 1, we observe a generally upward trend throughout the year. However, this growth is characterized by clear oscillations, which allow us to divide the year into four distinct seasonal phases:
- Seasonal Window 1 (January – April)
The first seasonal window, beginning in January and lasting through the first ten days of April, is historically the most bullish part of the year, particularly in January and February. - Seasonal Window 2 (April – July)
The second window shows a predominantly bearish trend from mid-April through early July. - Seasonal Window 3 (July – September)
The third window opens in July and marks another period of price growth, continuing through the late summer months into September. - Seasonal Window 4 (September – December)
The final part of the year, from September to December, exhibits a lack of clear direction. The market tends to fluctuate within a broad trading range during this period.
Figure 1 – Annual seasonal windows of gold: the chart on the left shows seasonality for the entire historical period analyzed, while the chart on the right compares different historical segments.

Still referring to Figure 1, particularly the image on the right, we can see how seasonality in gold plays out over different historical ranges. It's evident that the first two seasonal windows, early-year bullish and mid-year bearish, are consistently confirmed, although the strength of these trends varies across different periods.
As for the third window, movements appear less consistent in earlier historical segments, but even here we can confirm a general upward tendency during this time.
The situation is quite different in the final part of the year, where historical trends often diverge. As a result, this seasonal window is far less reliable and consistent compared to the rest of the year.
Backtest Insights: Do Seasonal Patterns Still Hold in 2024–2025?
An additional and interesting validation test involves checking whether these seasonal patterns persist even in years marked by a strong bullish bias, such as the last two (2024–2025), which could have potentially distorted the seasonal structure during certain parts of the year.
In Figure 2, we present a comparison between the 2024/2025 period (orange equity line) and the entire historical dataset. Remarkably, all four seasonal windows previously identified appear to remain fully confirmed, including the sideways-to-bearish phase in the second quarter. Of course, price movements during this recent period were more pronounced due to the sharp rise in gold prices.
Figure 2 – Seasonality of the gold futures market @GC: 2024–2025 vs entire historical dataset.

Building an Automated Trading Strategy Based on Gold Seasonality
Based on the findings so far, we can now apply these seasonal insights to a sample trading system. As for the final part of the year (Seasonal Window 4), the strategy remains flat, meaning no open positions, since the analysis showed a choppy, non-directional phase.
Here are the entry and exit rules for the strategy:
- Seasonal Window 1
Enter a long position on the first available trading day of January. - Seasonal Window 2
Enter a short position (reversing the previous long) on the first available trading day after April 8. - Seasonal Window 3
Enter a long position (reversing the previous short) on the first available trading day of July.
Exit the long position on the first available trading day of September. - Seasonal Window 4
Stay flat – no position is taken during this phase.
The performance analysis reveals very encouraging results. As shown in Figure 3, the overall equity line exhibits a rather smooth and steady upward trajectory, especially from 2010/2011 onward. Despite the extreme simplicity of the strategy, the cumulative net profit from 2003 to the present exceeds $230,000, confirming the effectiveness of this seasonal approach.
Since this is a long-term strategy, the total number of trades is naturally limited (68 trades), but the average trade value is relatively high at around $3,400.
Figure 3 – Equity curve of the strategy based on gold futures (@GC) seasonality. Backtest from 2003 to 2025.

Table 1 – Performance Summary for Seasonal Windows..
| Net Profit | Average Trade | % Profitable | # Trades | Max drawdown | |
| Seasonal_window 1 | $120,770.00 | $5,489.55 | 77.27 % | 22 | – $33,870.00 |
| Seasonal_window 2 | $8,610.00 | $374.35 | 47.83 % | 23 | – $54,900.00 |
| Seasonal window 3 | $101,710.00 | $4,422.17 | 65.22 % | 23 | – $25,740.00 |
| Long Trades | $222,480.00 | $4,944.00 | 71.11 % | 45 | – $41,200.00 |
| Short Trades | $8,610.00 | $374.35 | 47.83 % | 23 | – $54,900.00 |
| Complete Strategy | $231,090.00 | $3,398.38 | 63.24 % | 68 | – $71,490.00 |
Performance Breakdown: Long vs Short Trades in Seasonal Windows
As expected, the underlying bullish trend in gold heavily favors long trades, both in terms of net profit and average trade size, as well as in drawdown reduction. This raises the question: does it really make sense to trade the short side at all?
In hindsight, one might argue that focusing exclusively on long trades would have yielded nearly the same overall profit, while also achieving a lower drawdown. However, common sense suggests we shouldn’t completely discard the weaker side of the strategy. That's because various unpredictable macroeconomic factors could, in the future, reverse the currently well-established long-term uptrend.
Figure 4 – Performance comparison of the strategy: long trades (left) vs short trades (right).
Gold Seasonality Strategy vs Buy & Hold: Which Performs Better?
As a final step, it's worth comparing this type of seasonal window-based strategy with the classic long-term buy & hold approach. For this comparison, we'll use a more suitable instrument, the GLD ETF, which tracks the price of gold.
We'll examine three hypothetical investment scenarios:
- Traditional buy & hold of GLD
- The seasonal strategy without reinvesting profits
- The seasonal strategy with reinvestment of profits
Table 2 summarizes the key metrics, and Figure 5 shows the most relevant equity curves, assuming a position size of $10,000 for all approaches.
As expected, the simple buy & hold delivers the best net profit in absolute terms. However, it does so at the cost of a significant drawdown exceeding $20,000. The seasonality-based strategies don't match the absolute profit of buy & hold, but they clearly offer a more favorable risk profile, especially when considering real-money trading.
For example, the version with profit reinvestment achieves a total profit of over $41,000 while keeping drawdown relatively low at just $8,658, an appealing result given the simplicity of the strategy.
Table 2 – Key Metrics Comparison: Buy & Hold vs Seasonal Strategy (with and without reinvestment).
| Net Profit | Max drawdown | |
| Buy & Hold | $75,704.08 | – $20,206.32 |
| Seasonal Strategy (No Reinvestment) | $17,989.61 | – $3,719.01 |
| Seasonal Strategy (With Reinvestment) | $41,374.02 | – $8,658.80 |
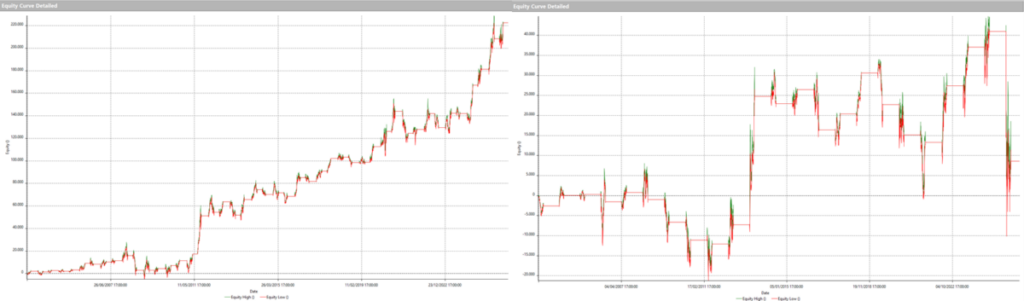
Figure 5 – Equity curve comparison: Buy & Hold (left) vs seasonal strategy with reinvestment (right).

Conclusion: Is Trading Gold Seasonality Worth It?
In conclusion, this analysis shows that it is indeed possible to profit from studying and applying seasonal trends in gold, even with extremely simple rules.
That said, it’s essential to remember that market behavior evolves over time. What worked in the past may not necessarily perform as well in the future. For this reason, a prudent next step could be to further diversify your portfolio, perhaps by exploring seasonal opportunities in other commodities as well.
Until next time, happy trading!
Benzinga Disclaimer: This article is from an unpaid external contributor. It does not represent Benzinga’s reporting and has not been edited for content or accuracy.