IBM (IBM) Stock Valuation Check After Mixed Short And Long Term Returns
IBM Corp IBM | 0.00 |
International Business Machines (IBM) is back on many investors’ screens after recent share price moves. The stock last closed at US$274.85 and is showing a mixed pattern of short and longer term returns.
The recent 1 day share price gain of 0.91% comes after a 7 day pullback of 8.92%. However, the 30 day share price return of 25.38% and very strong 3 and 5 year total shareholder returns suggest momentum has been building over the longer term.
If IBM’s recent move has you thinking about where growth and cash flows might come from next in AI infrastructure, it could be worth scanning 48 AI infrastructure stocks.
With IBM trading at US$274.85 and sitting roughly 20% below one intrinsic value estimate, the key question is whether investors are still underestimating its AI and hybrid cloud prospects or if the stock already reflects that future growth.
Most Popular Narrative: 7.3% Overvalued
According to the most widely followed narrative, IBM's fair value is set at $256.08, which sits below the recent close at $274.85 and frames the stock as slightly ahead of that estimate.
IBM represents a defensive growth technology investment transitioning into a software and AI-led enterprise platform company. While topline growth remains moderate, improving mix (software), strong margins, and durable cash flows underpin a compelling long-term investment case, particularly for investors seeking exposure to enterprise AI with lower volatility than pure-play SaaS peers.
Curious what earnings, margin profile, and future profit multiple sit behind that fair value line in the sand? The narrative leans on detailed segment forecasts and a firm view on how IBM's AI and hybrid cloud focus could reshape its cash flow mix over time.
Result: Fair Value of $256.08 (OVERVALUED)
However, this thesis still leans heavily on execution in AI and hybrid cloud, and any setback in quantum or consulting growth could quickly challenge that fair value story.
Wall Street's queuing for one rocket. While SpaceX counts down to its IPO, other companies tied to the new space race are already in orbit. → 20 Compelling Space Companies watchlist · Global Space Race Investing Ideas screener · Scan the sector by valuation on Rocket Lab's valuation page.
Another View: Cash Flows Point The Other Way
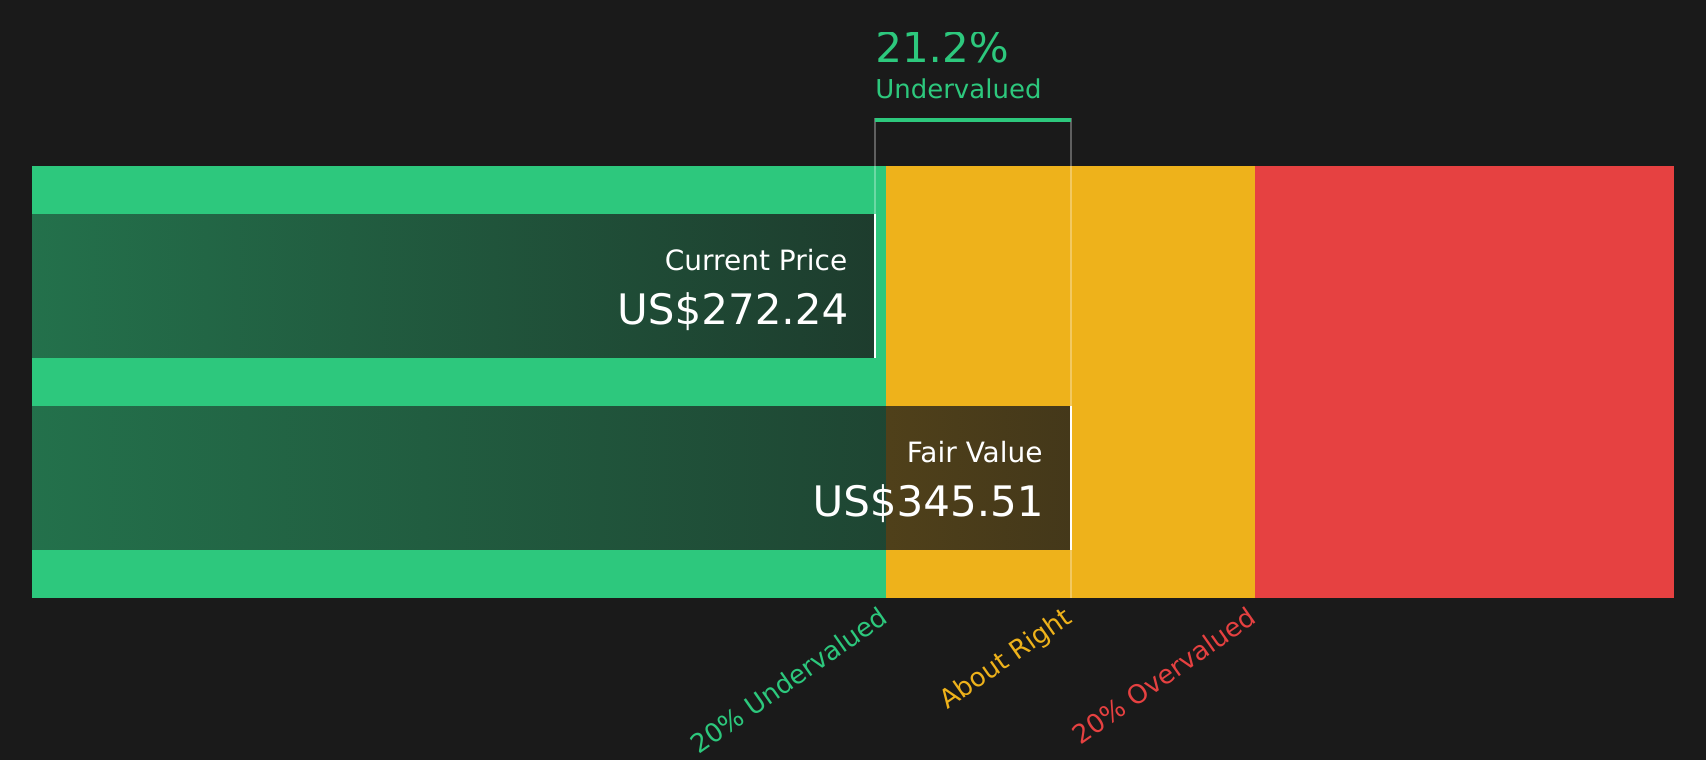
The 7.3% overvalued narrative suggests that IBM sits above its US$256.08 fair value line. Our DCF model, however, puts fair value closer to US$346.16, which is about 20.6% above the current US$274.85 price and frames the stock as undervalued instead. Which story feels more convincing to you?
For a closer look at the assumptions behind those cash flows, and how sensitive the outcome is to small changes in growth or discount rates, Look into how the SWS DCF model arrives at its fair value.
Simply Wall St performs a discounted cash flow (DCF) on every stock in the world every day (check out International Business Machines for example). We show the entire calculation in full. You can track the result in your watchlist or portfolio and be alerted when this changes, or use our stock screener to discover 46 high quality undervalued stocks. If you save a screener we even alert you when new companies match - so you never miss a potential opportunity.
Next Steps
With mixed views on fair value and IBM's AI and hybrid cloud path, sentiment is far from settled. Move quickly, review the details yourself, and weigh 4 key rewards and 1 important warning sign
Looking for more investment ideas?
IBM might be front of mind today, but you do not want to overlook other stocks that could fit your goals just as well or even better.
- Target potential mispricings by scanning 46 high quality undervalued stocks that combine solid fundamentals with prices that may not fully reflect their business strength.
- Prioritize resilience with 67 resilient stocks with low risk scores so you can focus on companies that score well on stability and balance sheet quality.
- Spot future standouts before the crowd by reviewing the screener containing 20 high quality undiscovered gems that already show strong underlying metrics.
This article by Simply Wall St is general in nature. We provide commentary based on historical data and analyst forecasts only using an unbiased methodology and our articles are not intended to be financial advice. It does not constitute a recommendation to buy or sell any stock, and does not take account of your objectives, or your financial situation. We aim to bring you long-term focused analysis driven by fundamental data. Note that our analysis may not factor in the latest price-sensitive company announcements or qualitative material. Simply Wall St has no position in any stocks mentioned.