In One Chart | Historical Performance of Major Asset Classes During US Dollar Index Decline: Gold Soars, Copper, Oil Prices Surge
S&P 500 index SPX | 0.00 | |
SPDR Gold GLD | 0.00 | |
Gold Trust Ishares IAU | 0.00 | |
VanEck Vectors Gold Miners ETF GDX | 0.00 | |
MicroSectors Gold Miners 3X Leveraged ETN GDXU | 0.00 |
Looking back at several instances of the US Dollar Index (DXY) decline since 1970, the average drawdown of the DXY has been about 28.8%, with an average duration of around 38 months. Notably, from 1985 to 1987, the DXY had its largest drawdown of 44.1%, lasting for 34 months.
Over the past three years, since reaching a decade-high in September 2022, the DXY has been on a downward trend. As of September 24, 2025, the current cycle has seen a drawdown of about 12.83%, with a duration of 36 months.
What investors are most concerned about is which assets benefit the most and which markets perform the best during a "weak dollar" cycle. We have conducted a detailed analysis for investors' reference.
- From 1971 to 1973, the breakdown of the Bretton Woods system triggered a dollar credit crisis, and commodities benefited significantly.
- From 1976 to 1980, policy mistakes by the Federal Reserve led to hyperinflation, and commodities performed the best in this high-inflation environment.
- From 1985 to 1987, the Plaza Accord led to an orderly depreciation of the dollar, and the Japanese stock market outperformed globally.
- From 2002 to 2008, the "twin deficits" problem caused the dollar to weaken over the long term, and commodities entered a bull market.
It can be seen that during periods of dollar weakness, non-U.S. assets often perform well. The logic is actually quite simple: it is the reallocation of funds from dollar assets to non-U.S. assets.
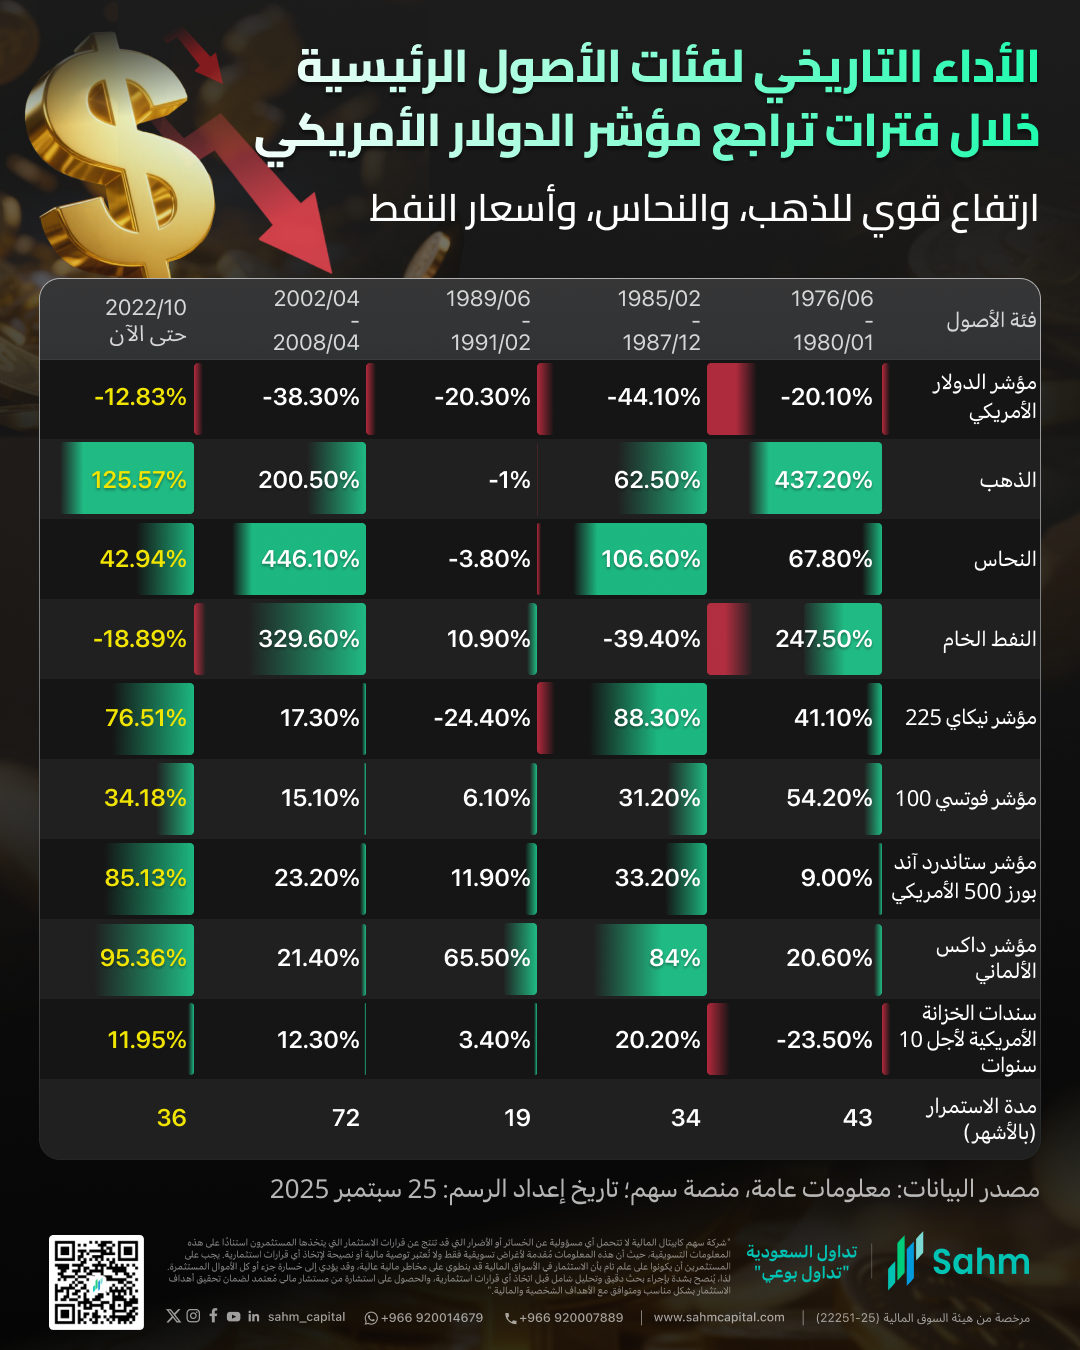
During the US Dollar Index's decline cycles, asset performance has been highly divergent. Commodities have been the core beneficiaries, with gold experiencing significant gains in most cycles (for example, a 437.2% increase from 1976 to 1980 and a 200.5% increase from 2002 to 2008). Copper and crude oil have also seen multiple substantial upsurges, with copper rising by 446.1% and crude oil by 329.6% from 2002 to 2008, illustrating the pricing logic of "a weak dollar leads to strong commodities."
Global stock markets have generally performed well, with indices such as Germany's DAX (which rose by 84.0% from 1985 to 1987) and the US S&P 500 index(SPX.US) showing positive returns across multiple cycles. China's Shanghai Composite Index also recorded increases of 38.5% and 130.26% in the cycles for which data is available, reflecting the supportive effect of a loose liquidity environment on stock markets.
Bond performance has been mixed, with the 10-year US Treasury note falling in some cycles and rising in others, influenced by a variety of factors. Overall, during periods of the dollar's decline, funds often flow towards commodities and stocks, boosting their performance.
| Asset Class | 1971/08-1973/06 | 1976/06-1980/01 | 1985/02-1987/12 | 1989/06-1991/02 | 2002/04-2008/04 | 2022/10-Now |
| US Dollar Index | -21.40% | -20.10% | -44.10% | -20.30% | -38.30% | -13.50% |
| Gold | 181.20% | 437.20% | 62.50% | -1% | 200.50% | 120.98% |
| Copper | 84.10% | 67.80% | 106.60% | -3.80% | 446.10% | 36.20% |
| Crude Oil | 55.20% | 247.50% | -39.40% | 10.90% | 329.60% | -20.57% |
| Nikkei 225 | 99.80% | 41.10% | 88.30% | -24.40% | 17.30% | 74.67% |
| FTSE 100 | 2.70% | 54.20% | 31.20% | 6.10% | 15.10% | 33.78% |
| S&P 500 | 8.80% | 9.00% | 33.20% | 11.90% | 23.20% | 84.08% |
| DAX | 11.80% | 20.60% | 84% | 65.50% | 21.40% | 95.17% |
| 10-Year US Treasury Bond | -4.40% | -23.50% | 20.20% | 3.40% | 12.30% | 11.95% |
| Duration (months) | 23 | 43 | 34 | 19 | 72 | 36? |
Investment Opportunities
The following investment opportunities are provided for investors' reference:
US gold ETFs include: SPDR Gold(GLD.US), Gold Trust Ishares(IAU.US), and VanEck Vectors Gold Miners ETF(GDX.US). Leveraged options include MicroSectors Gold Miners 3X Leveraged ETN(GDXU.US), Daily Gold Miners Bull 2x Shares(NUGT.US), and Ultra Gold Proshares(UGL.US).
Related to copper ETFs in the US market: Global X Copper Miners ETF(COPX.US) , Spdr Series Trust Spdr S&P Metals & Mining ETF(XME.US) , iShares Trust iShares Copper and Metals Mining ETF(ICOP.US) , United Sts Commodity Index Fd Com Unit Repstg U S Copper Index Fd(CPER.US) , Ishares Inc Msci Glbl Mtl&Mng Produ ETF(PICK.US).