Is Apollo Global Management (APO) Attractive After Recent Share Price Rebound?
Apollo Global Management Inc APO | 0.00 |
- If you are wondering whether Apollo Global Management at around US$114.82 is a bargain or already pricing in a lot of optimism, the starting point is understanding what the current market price is implying about its future.
- The stock has moved 9.0% over the last 7 days and 9.9% over the last 30 days, yet year to date it is still showing a 21.7% decline and a 1 year return of 8.8% decline, even with a 3 year return of 84.7% and a 5 year return of 148.7%.
- Recent headlines around Apollo Global Management have focused on its role as a major diversified financial player, including ongoing attention to its fundraising activities, deployment of capital across credit and private equity strategies, and its position within alternative asset management. This mix of growth projects and sector wide sentiment on alternative managers helps frame why the share price has seen both recent strength and longer term volatility.
- On Simply Wall St's valuation checks Apollo Global Management currently scores 4 out of 6. The next sections will walk through what that means using different valuation methods and then finish with a way to think about the stock that goes beyond any single model.
Approach 1: Apollo Global Management Excess Returns Analysis
The Excess Returns model evaluates how much value Apollo Global Management generates above the return that shareholders are assumed to require. It starts with the equity invested in the business and compares the earnings generated on that equity to the estimated cost of equity.
For Apollo, the book value is $37.90 per share and the stable book value estimate is $61.83 per share, based on weighted future book value estimates from 3 analysts. The stable EPS is $10.28 per share, sourced from weighted future return on equity estimates from 6 analysts. Against a cost of equity of $5.20 per share, this implies an excess return of $5.08 per share on an average return on equity of 16.62%.
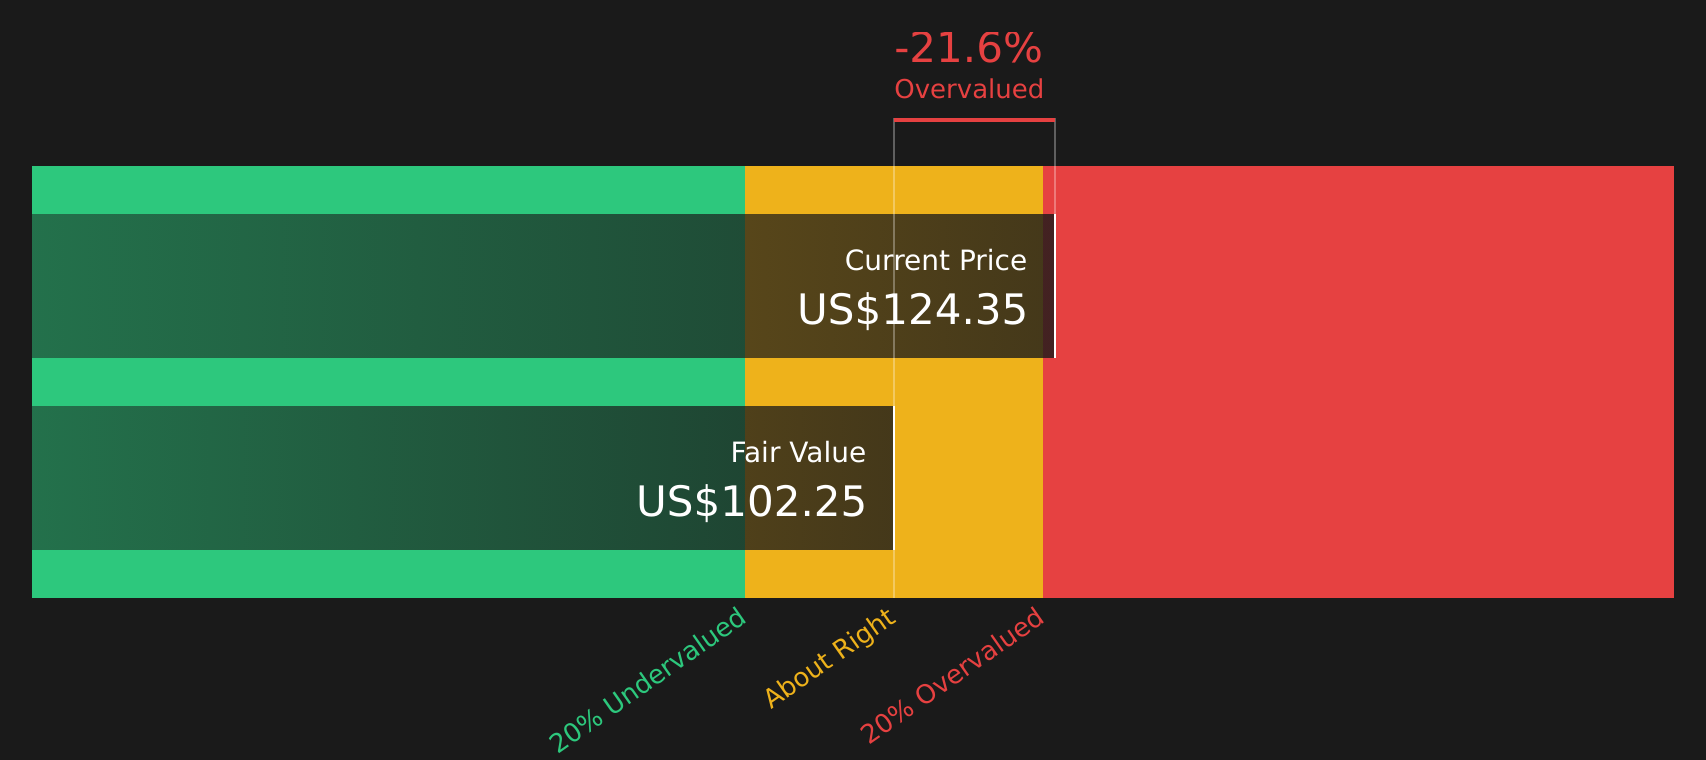
These excess returns are projected forward and discounted to arrive at an intrinsic value estimate of $163.49 per share. Compared with the recent share price of about $114.82, the model implies the stock is 29.8% undervalued under these assumptions.
Result: UNDERVALUED
Our Excess Returns analysis suggests Apollo Global Management is undervalued by 29.8%. Track this in your watchlist or portfolio, or discover 57 more high quality undervalued stocks.
Approach 2: Apollo Global Management Price vs Earnings
For a profitable company like Apollo Global Management, the P/E ratio is a straightforward way to link what you pay per share to the earnings that support that price. It helps you see how many dollars investors are currently willing to pay for each dollar of earnings.
What counts as a “normal” P/E depends on how the market views a company’s earnings growth potential and risk. Higher expected growth or lower perceived risk can justify a higher P/E, while slower growth or higher risk usually points to a lower one.
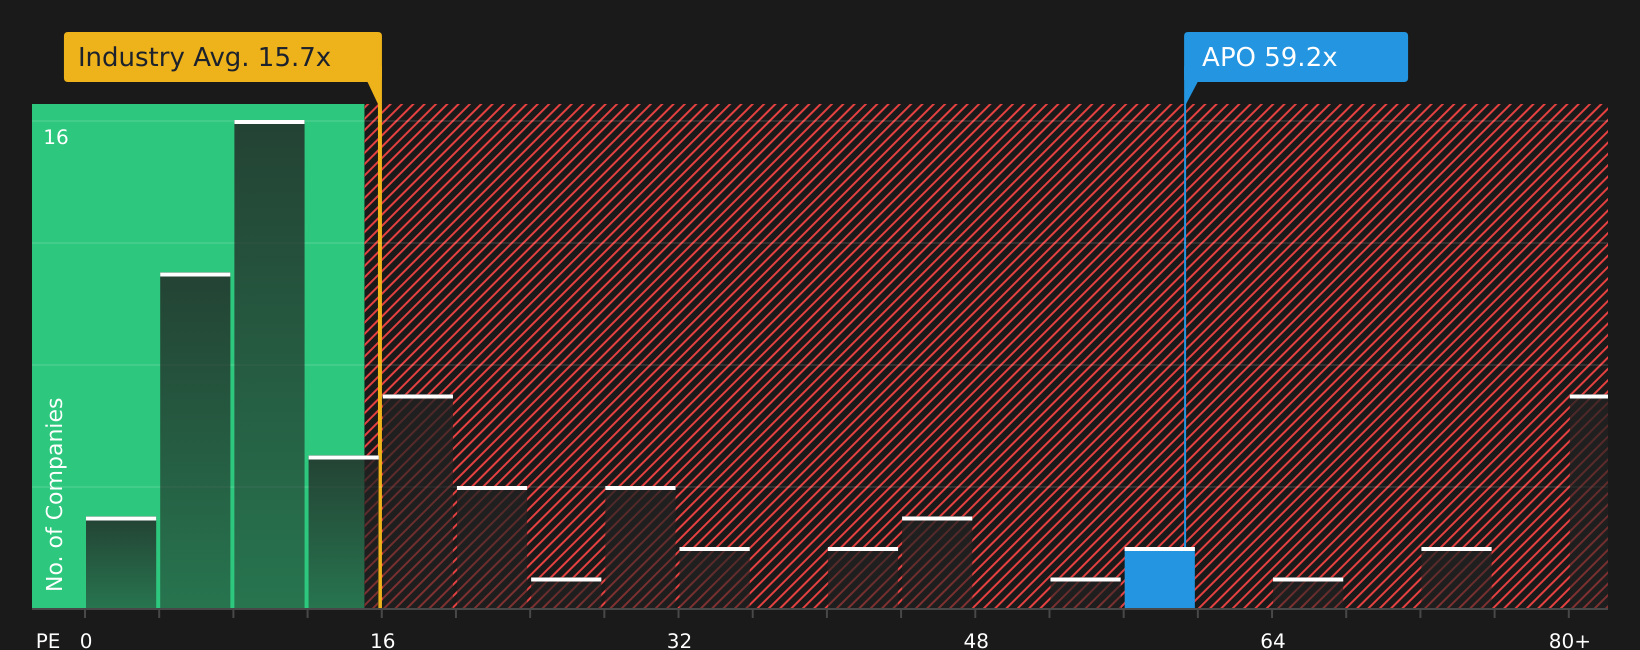
Apollo currently trades on a P/E of 18.95x. That is above the Diversified Financial industry average of 16.88x and the peer group average of 14.59x. Simply Wall St’s Fair Ratio for Apollo is 19.34x, which is an estimate of what the P/E could be given its earnings profile, industry, profit margins, market value and risk factors.
This Fair Ratio is more tailored than a simple comparison to peers or the industry because it adjusts for company specific characteristics rather than assuming one size fits all. With the current P/E of 18.95x sitting slightly below the Fair Ratio of 19.34x, the shares appear slightly undervalued on this measure.
Result: UNDERVALUED
P/E ratios tell one story, but what if the real opportunity lies elsewhere? Start investing in legacies, not executives. Discover our 18 top founder-led companies.
Upgrade Your Decision Making: Choose your Apollo Global Management Narrative
Earlier it was mentioned that there is an even better way to understand valuation, so Narratives are introduced here as your way of putting a clear story behind the numbers, linking your view on Apollo Global Management’s future revenue, earnings and margins to a fair value estimate that can be compared with the current share price.
On Simply Wall St’s Community page, Narratives let you set assumptions and see a forecast and fair value that reflect your own view, then track how that fair value moves as new earnings, news or valuation inputs are added.
For Apollo, one investor might align with a more cautious view that sits closer to a Fair Value of about US$158 per share. Another might lean toward a more optimistic view closer to US$193. By comparing each Fair Value with the market price, both investors can decide whether Apollo looks closer to a potential buy, hold or sell for their own approach without relying on a single model or opinion.
Do you think there's more to the story for Apollo Global Management? Head over to our Community to see what others are saying!

This article by Simply Wall St is general in nature. We provide commentary based on historical data and analyst forecasts only using an unbiased methodology and our articles are not intended to be financial advice. It does not constitute a recommendation to buy or sell any stock, and does not take account of your objectives, or your financial situation. We aim to bring you long-term focused analysis driven by fundamental data. Note that our analysis may not factor in the latest price-sensitive company announcements or qualitative material. Simply Wall St has no position in any stocks mentioned.