Is Eli Lilly (LLY) Still Attractive After Strong Multi‑Year Share Price Gains?
Eli Lilly and Company LLY | 922.50 923.90 | -0.76% +0.15% Post |
- If you are wondering whether Eli Lilly's current share price still makes sense for new money, the key question is how that price lines up against its underlying value.
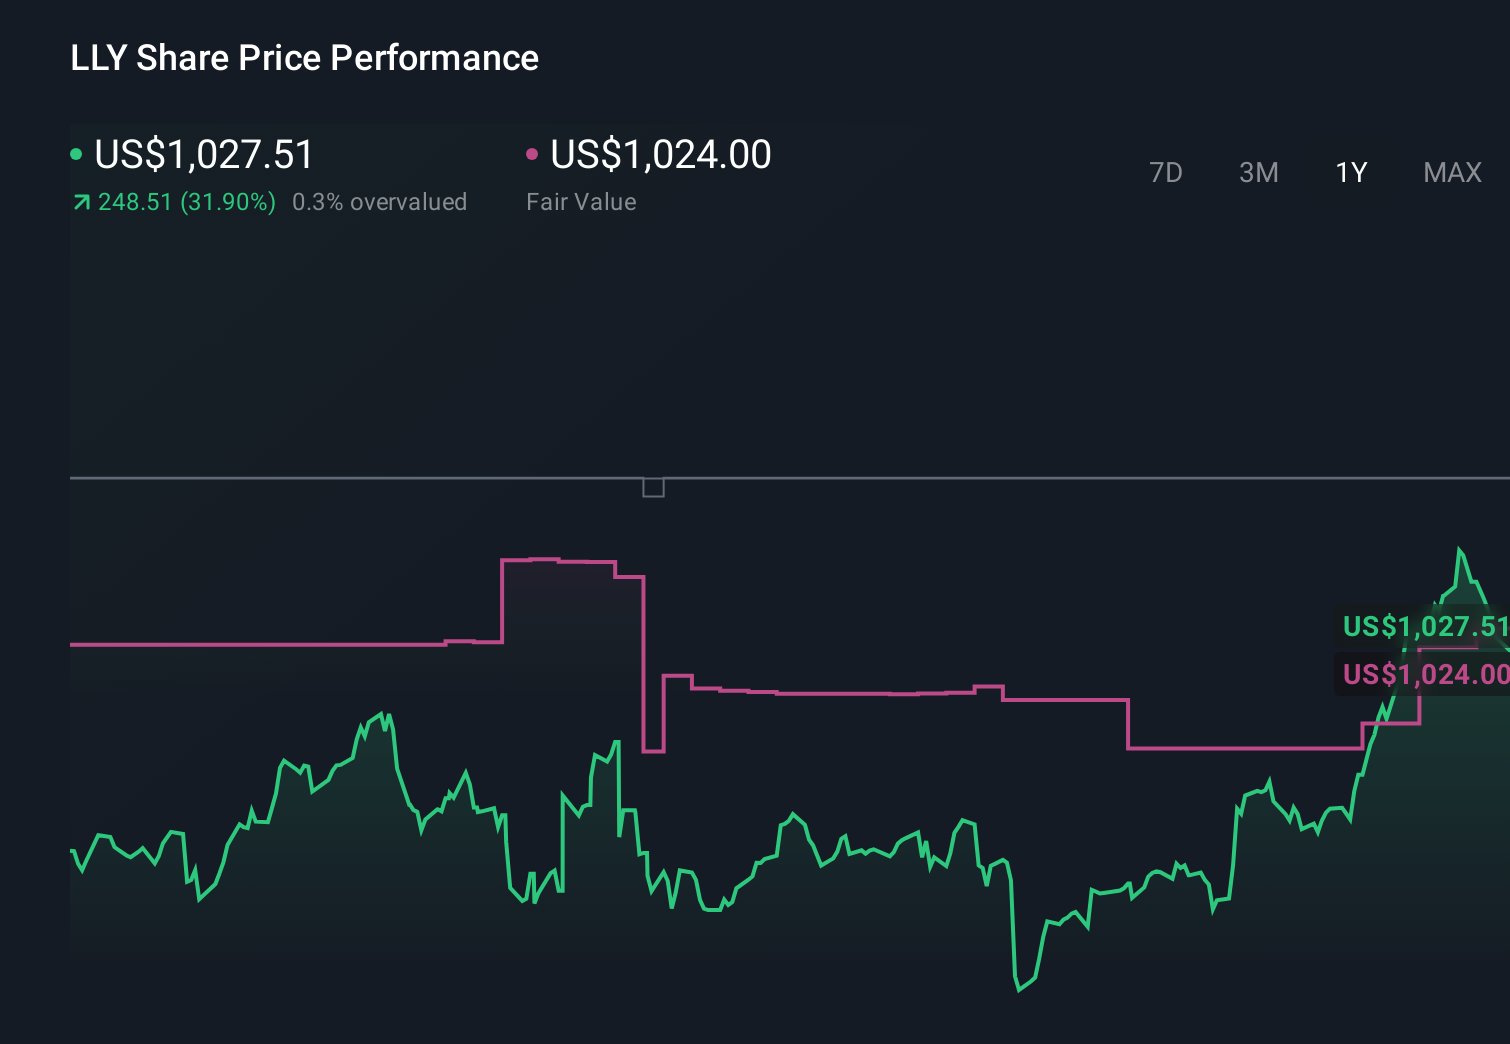
- The stock most recently closed at US$1,058.18, with returns of 2.0% over the last 7 days, a 0.5% decline over 30 days, a 2.1% decline year to date, 21.4% over 1 year, 214.0% over 3 years and a very large gain over 5 years.
- Recent news coverage around Eli Lilly has largely focused on its position in major treatment areas and the market's expectations for its product pipeline and long term growth potential. This context has kept attention on whether current sentiment is already reflected in the share price or if the market might be mispricing the stock.
- Simply Wall St currently assigns Eli Lilly a value score of 2 out of 6, indicating it screens as undervalued on 2 of the 6 valuation checks used. Next we will look at what that means across different valuation methods and why there may be an even better way to think about value by the end of this article.
Eli Lilly scores just 2/6 on our valuation checks. See what other red flags we found in the full valuation breakdown.
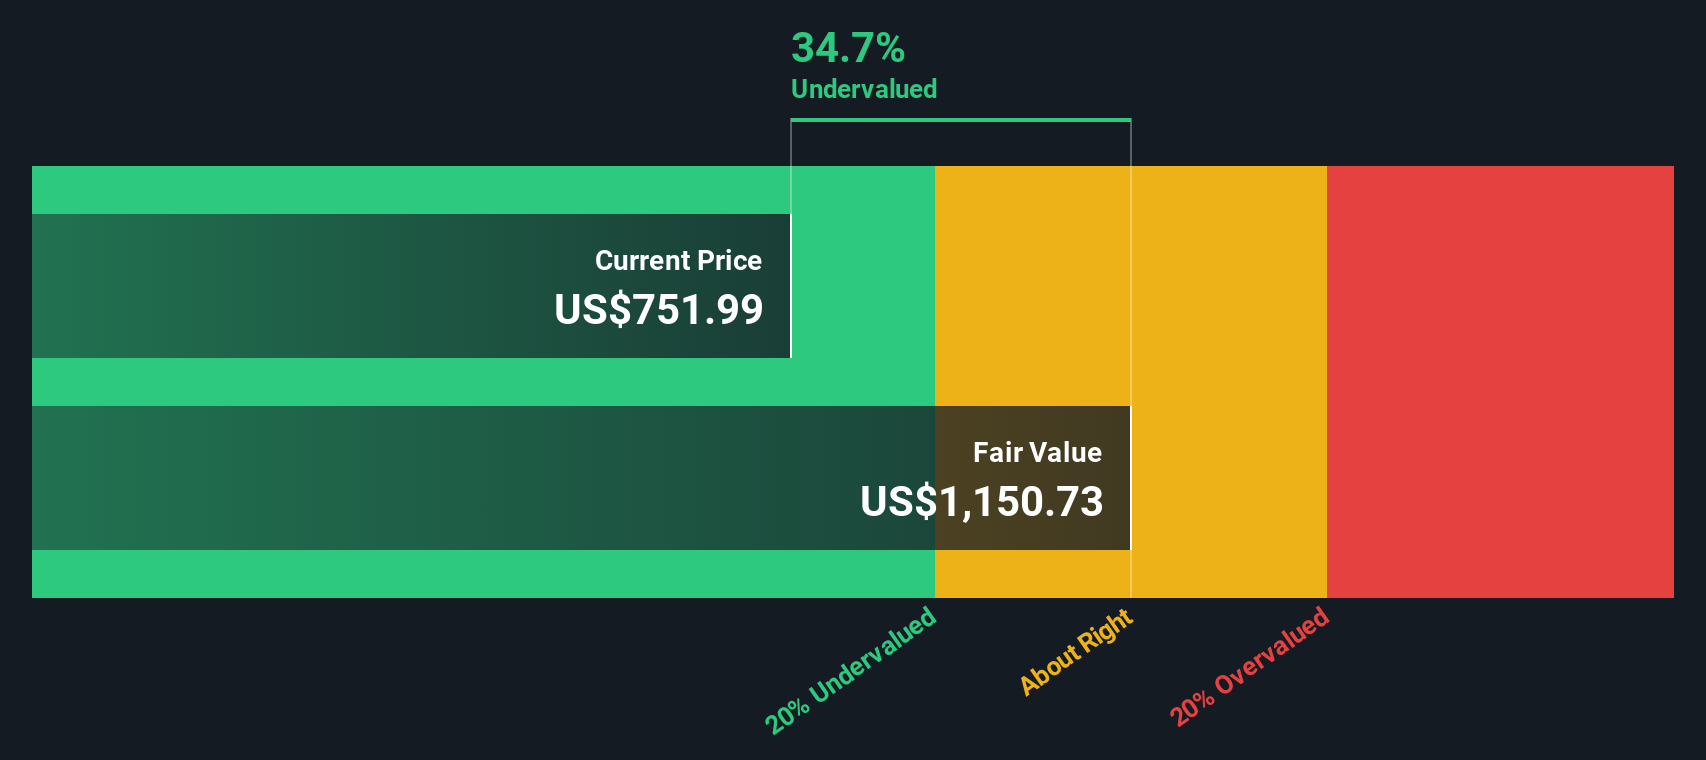
Approach 1: Eli Lilly Discounted Cash Flow (DCF) Analysis
A Discounted Cash Flow, or DCF, model estimates what a company might be worth by projecting its future cash flows and then discounting those back to today using a required rate of return.
For Eli Lilly, Simply Wall St uses a 2 Stage Free Cash Flow to Equity model. The latest twelve month free cash flow is about $6.97b. Analyst and extrapolated estimates in the model see free cash flow at about $44.17b in 2030. Intermediate years between 2026 and 2035 are projected in the $16.10b to $62.21b range on an undiscounted basis.
After discounting those projected cash flows to today, the model arrives at an estimated intrinsic value of US$1,345.00 per share. Compared with the recent share price of US$1,058.18, this DCF output implies the stock trades at about a 21.3% discount to the model’s estimate. On this measure, Eli Lilly screens as undervalued according to the model.
Result: UNDERVALUED
Our Discounted Cash Flow (DCF) analysis suggests Eli Lilly is undervalued by 21.3%. Track this in your watchlist or portfolio, or discover 52 more high quality undervalued stocks.
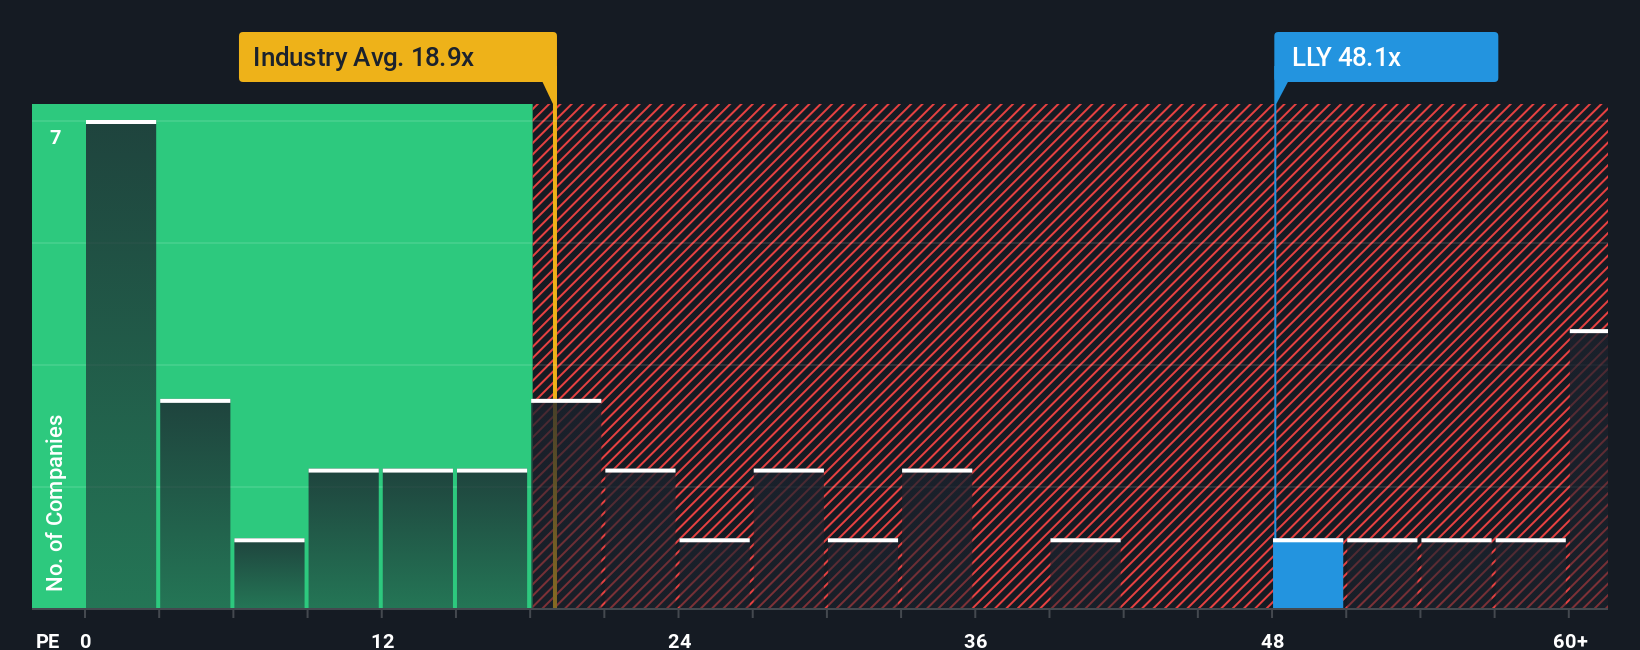
Approach 2: Eli Lilly Price vs Earnings
For a profitable company like Eli Lilly, the P/E ratio is a useful way to think about what you are paying for each dollar of earnings. A higher P/E can sometimes reflect stronger growth expectations or lower perceived risk. A lower P/E can point to more modest growth expectations or higher risk.
Eli Lilly currently trades on a P/E of 45.90x. That is above the Pharmaceuticals industry average of 21.18x and above the peer average of 19.01x, so on simple comparisons the stock looks expensive relative to many large listed drug makers.
Simply Wall St’s Fair Ratio framework goes a step further by estimating what a company’s P/E might be, given its earnings growth profile, industry, profit margins, market cap and risk factors. For Eli Lilly, this Fair Ratio is 43.46x. Because this is tailored to the company, it can be more informative than a blunt comparison with peers or the broad industry.
Comparing the Fair Ratio of 43.46x with the actual P/E of 45.90x suggests the shares trade somewhat above what the model implies is a fair level.
Result: OVERVALUED
P/E ratios tell one story, but what if the real opportunity lies elsewhere? Start investing in legacies, not executives. Discover our 22 top founder-led companies.
Upgrade Your Decision Making: Choose your Eli Lilly Narrative
Earlier we mentioned that there is an even better way to understand valuation, so let us introduce you to Narratives, a simple way to connect the story you believe about Eli Lilly with the numbers you see on screen.
A Narrative is your own structured view of the company, where you spell out what you think is a reasonable fair value, how revenue, earnings and profit margins might evolve, and what that implies for Eli Lilly over time.
On Simply Wall St’s Community page, millions of investors use Narratives to link a company story to a financial forecast and then to a fair value. This makes it possible to quickly compare that fair value with the current share price and decide whether the stock looks attractive or not for your goals.
Because Narratives update automatically when new information comes in, such as earnings releases or major news, your view of Eli Lilly can stay aligned with the latest data without you rebuilding a spreadsheet each time.
You might see one Eli Lilly Narrative where an investor assumes a relatively high fair value with stronger long term margins, while another assumes a lower fair value with more conservative revenue and earnings estimates. Comparing those side by side can help you decide which story you find more reasonable.
Do you think there's more to the story for Eli Lilly? Head over to our Community to see what others are saying!
This article by Simply Wall St is general in nature. We provide commentary based on historical data and analyst forecasts only using an unbiased methodology and our articles are not intended to be financial advice. It does not constitute a recommendation to buy or sell any stock, and does not take account of your objectives, or your financial situation. We aim to bring you long-term focused analysis driven by fundamental data. Note that our analysis may not factor in the latest price-sensitive company announcements or qualitative material. Simply Wall St has no position in any stocks mentioned.