Is EMCOR Group Still a Bargain After Shares Surge 40% in 2025?
EMCOR Group, Inc. EME | 0.00 |
If you have been eyeing EMCOR Group, you are definitely not alone. With shares closing recently at $640.57, this stock has been on a tear that makes it hard to ignore. In just the past week, EMCOR has edged up 1.4%, while over the past month it’s climbed 2.7%. The bigger picture, however, is truly impressive: up 40.0% year-to-date, 50.3% in the last year, and 460.0% and 844.0% over the past three and five years respectively. That kind of consistent outperformance makes even the most seasoned investors stop and ask whether there is still value here, or if the stock is nearing its peak.
Part of EMCOR’s sustained momentum can be traced back to broader market developments that have spotlighted infrastructure renewal and the modernization of building systems. These themes have only grown more prominent, encouraging both retail and institutional investors to keep driving demand for shares. Still, with all this growth, the real question for potential buyers or holders is whether EMCOR remains undervalued by the market, or if its run is due for a breather.
To answer that, let’s look at EMCOR’s valuation score. The company ticks the box in 5 out of 6 key checks for being undervalued. This strong result puts it at the upper end of the value spectrum, according to our assessment system. Next, we will break down these different valuation tests, and share an even more insightful way to judge EMCOR’s worth before we’re done.
EMCOR Group delivered 50.3% returns over the last year. See how this stacks up to the rest of the Construction industry.Approach 1: EMCOR Group Discounted Cash Flow (DCF) Analysis
The Discounted Cash Flow (DCF) model estimates a company’s intrinsic value by projecting its expected future cash flows and discounting them back to today’s dollars. This approach helps determine whether the current market price reflects a company’s true worth based on its long-term earning power.
For EMCOR Group, the latest available Free Cash Flow is $1.21 Billion. Analysts supply FCF projections for the next five years, with figures moving from $1.27 Billion in 2026 up to $2.76 Billion by 2029. Beyond that, Simply Wall St extends the outlook and forecasts Free Cash Flow reaching about $4.32 Billion in 2035. All these cash flows are measured in US dollars.
According to these projections and the 2 Stage Free Cash Flow to Equity model, EMCOR’s estimated intrinsic value stands at $1,316.63 per share. With shares recently closing at $640.57, the DCF model implies the stock is trading at a 51.3% discount to its true value. In other words, the analysis suggests EMCOR Group remains highly undervalued at current prices.
Result: UNDERVALUED
Head to the Valuation section of our Company Report for more details on how we arrive at this Fair Value for EMCOR Group.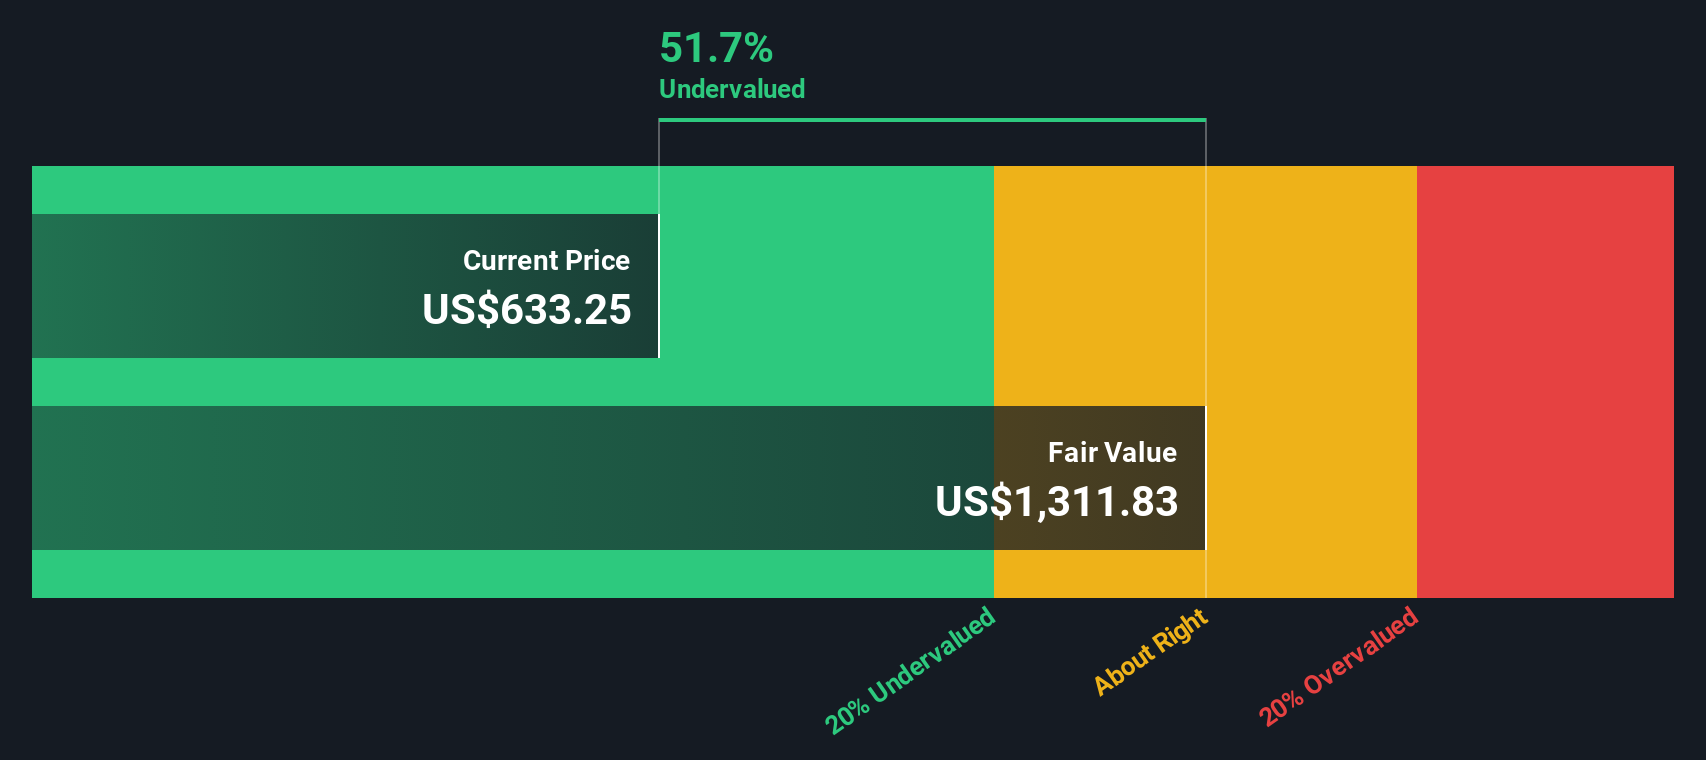
Approach 2: EMCOR Group Price vs Earnings
For companies with solid profitability, the price-to-earnings (PE) ratio is a time-tested tool to judge value. It compares a company’s current share price to its per-share earnings, helping investors understand how much they are paying for each dollar of profit.
It’s important to note that what counts as a “fair” PE ratio depends on factors like expected earnings growth and business risks. High-growth or low-risk companies typically merit higher PE ratios, while slower growers or riskier firms deserve lower ones.
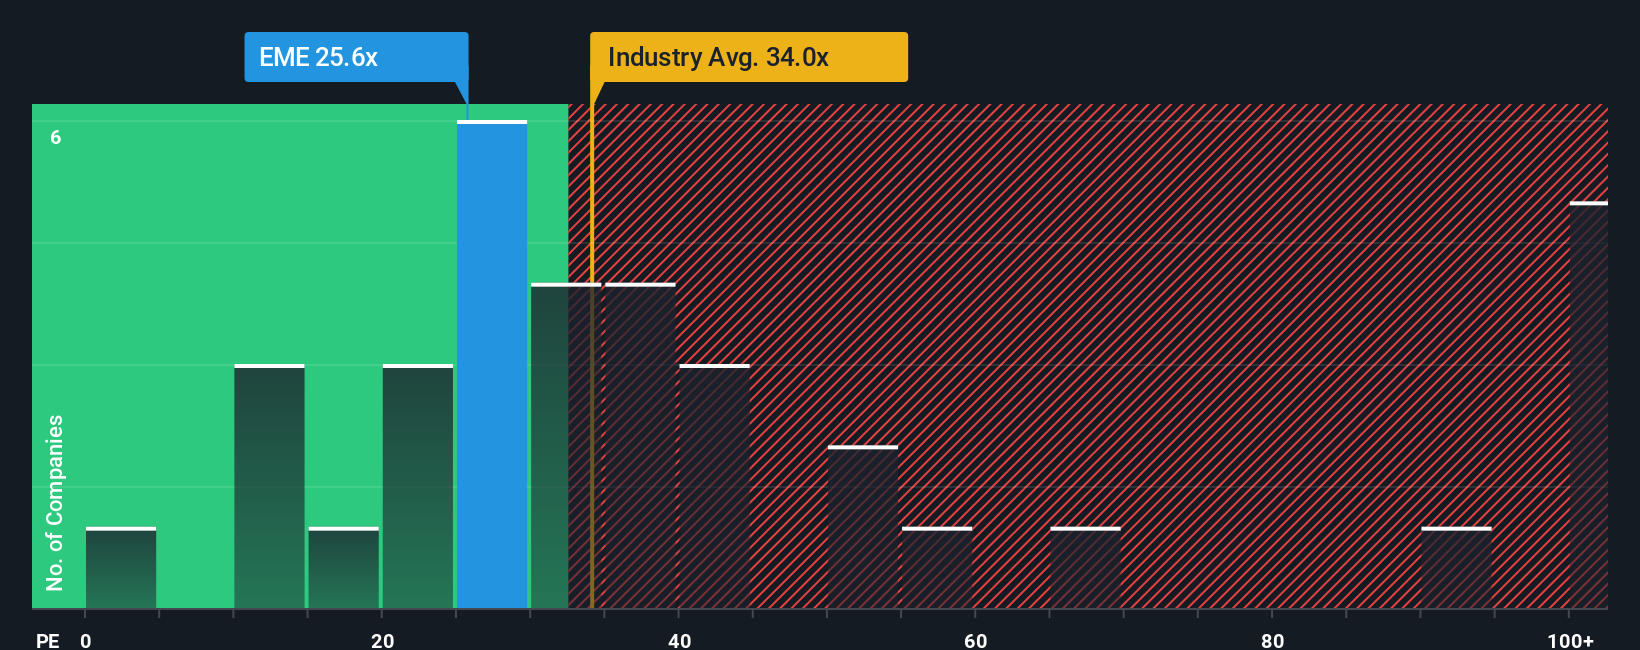
EMCOR Group currently trades at a PE ratio of 25.9x. This is below the Construction industry average of 34.5x and is much lower than the peer group average of 47.3x. At first glance, that makes EMCOR appear attractively priced compared to others in its space.
However, Simply Wall St’s proprietary Fair Ratio offers a more calibrated perspective. This metric does not just take industry averages or group benchmarks at face value, but adjusts for vital details like EMCOR’s earnings growth potential, profitability, risk profile, industry category, and even market capitalization. For this reason, the Fair Ratio of 27.3x provides a more tailored expectation for EMCOR than a simple comparison with peers or industry figures.
As a result, EMCOR’s actual PE ratio of 25.9x is just below its Fair Ratio. This suggests that, after accounting for its unique strengths and business dynamics, the stock remains undervalued on a PE basis.
Result: UNDERVALUED
Upgrade Your Decision Making: Choose your EMCOR Group Narrative
Earlier we mentioned that there is an even better way to understand valuation, so let’s introduce you to Narratives. A Narrative is simply your perspective on a company, connecting the story—your expectations for revenue, profit margins, and the business outlook—with a concrete financial forecast and a fair value estimate. Narratives let you move beyond just looking at numbers by anchoring those figures to real-world drivers, risks, and opportunities, making your investment thesis clear and actionable.
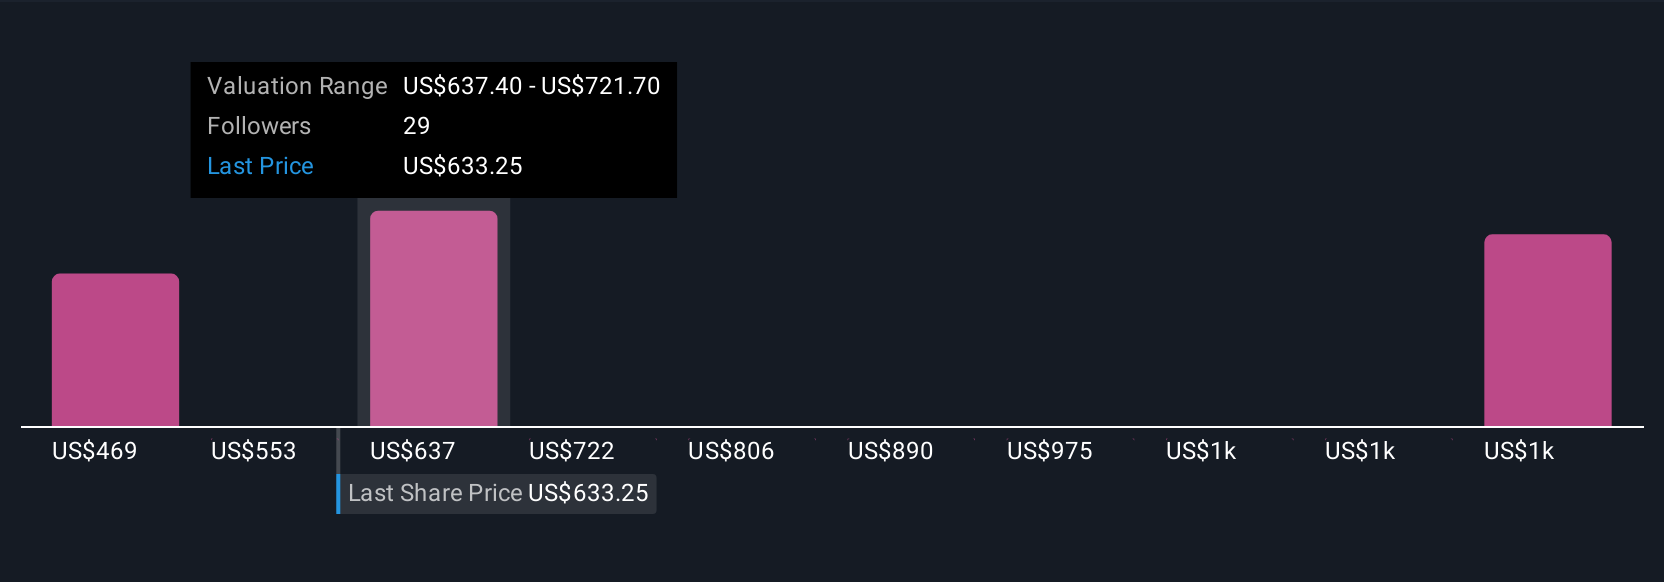
Narratives, available within the Simply Wall St Community page, are easy-to-use tools trusted by millions of investors. They help you decide when to buy, hold, or sell by comparing your calculated Fair Value to the current market price, and they automatically update when new information comes out, such as earnings reports or major news. For EMCOR Group, one investor’s Narrative might see fair value at $468.79 per share based on moderate growth and cyclical caution, while another believes the fair value is $681.67 per share, reflecting optimism about data center demand and margin expansion. Narratives empower you to invest based on your own outlook, and adapt your thesis as the facts change.
For EMCOR Group, however, we'll make it really easy for you with previews of two leading EMCOR Group Narratives:
- 🐂 EMCOR Group Bull Case
Fair Value: $681.67
Current Price vs Fair Value: 6.03% undervalued
Revenue Growth Rate: 9.7%
- Analysts estimate robust sector demand, sustainability trends, and digital integration will drive a record-high, diversified project backlog and long-term operating margin improvement.
- Strategic acquisitions and investment in prefabrication and talent are key to enhancing efficiency and maintaining competitive strength, even with labor market challenges.
- Consensus price target shows shares are close to fully valued, with continued macro growth drivers. Analysts advise independent sense checking of their assumptions.
- 🐻 EMCOR Group Bear Case
Fair Value: $468.79
Current Price vs Fair Value: 36.6% overvalued
Revenue Growth Rate: 9%
- EMCOR’s long-term catalysts include infrastructure spending, AI-driven data center demand, electrification, reshoring, and expanded capital allocation through M&A.
- Top risks are economic slowdowns, labor shortages and rising wage costs, regulatory or government funding changes, supply chain disruptions, and industry cyclicality.
- Valuation assumes a 9% revenue growth, 6.5% net margin, 20x P/E, and 8% discount rate. This results in an intrinsic value that is well below today's share price, suggesting limited upside.
This article by Simply Wall St is general in nature. We provide commentary based on historical data and analyst forecasts only using an unbiased methodology and our articles are not intended to be financial advice. It does not constitute a recommendation to buy or sell any stock, and does not take account of your objectives, or your financial situation. We aim to bring you long-term focused analysis driven by fundamental data. Note that our analysis may not factor in the latest price-sensitive company announcements or qualitative material. Simply Wall St has no position in any stocks mentioned.