Is Huntsman (HUN) Now Attractive After A 29.6% Year To Date Rebound?
Huntsman Corporation HUN | 13.59 13.61 | +0.15% +0.15% Pre |
- If you are trying to figure out whether Huntsman is a bargain or a value trap at around US$13.21, you will want to see how the current share price lines up with a few different valuation yardsticks.
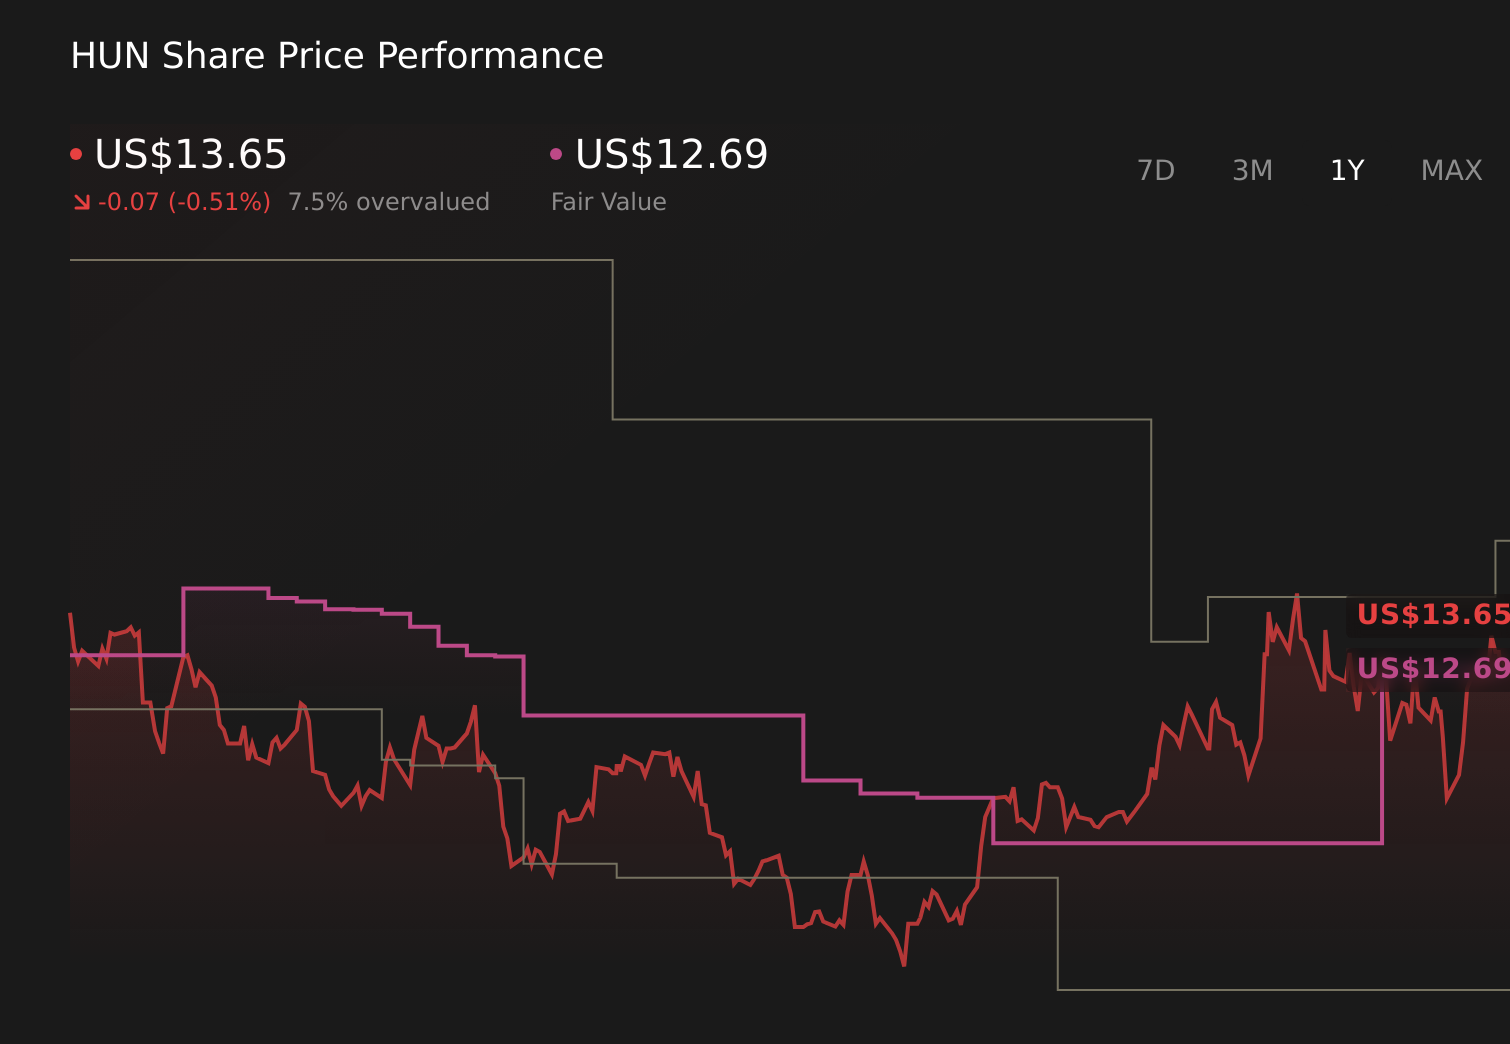
- The stock has returned 1.2% over the last week and 10.9% over the last month, while year to date it is up 29.6% but still shows a 16.8% decline over 1 year, a 50.0% decline over 3 years and a 43.6% decline over 5 years.
- These mixed returns have put fresh attention on Huntsman, with recent coverage focusing less on short term trading and more on how investors should read the long term share price record. For many, the key question is whether the current level around US$13.21 reflects underlying business quality or a market that has simply marked the shares down too far.
- On our checklist of 6 valuation tests, Huntsman scores 3 out of 6. This suggests some areas look inexpensive while others appear more balanced. Next, we will walk through those methods in detail and then finish with a broader way to think about what that score really means for you.
Approach 1: Huntsman Discounted Cash Flow (DCF) Analysis
A Discounted Cash Flow, or DCF, model takes estimates of a company’s future cash flows and discounts them back to today to arrive at an implied value per share. It is essentially asking what those future dollars are worth in today’s money.
For Huntsman, the model used here is a 2 Stage Free Cash Flow to Equity approach, based on cash flow projections in US$. The latest twelve month free cash flow is about $169.6 million. Analysts provide nearer term estimates, such as projected free cash flow of $140.5 million in 2027, and then Simply Wall St extrapolates further out, with estimates running to 2035.
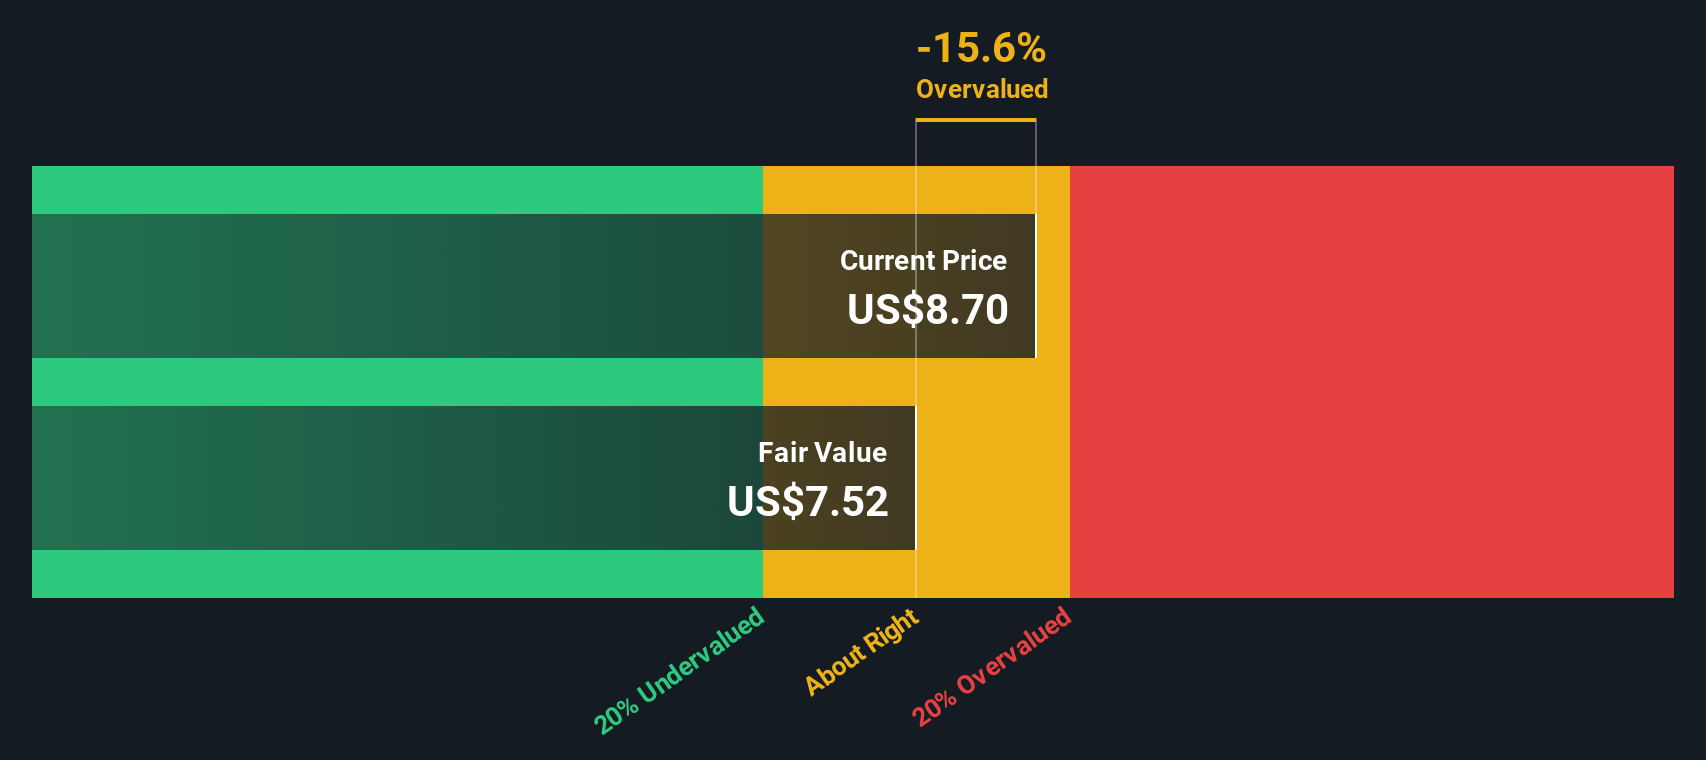
When all of those projected cash flows are discounted back, the DCF model arrives at an estimated intrinsic value of US$9.92 per share. Compared with the recent share price of around US$13.21, that implies the stock is about 33.2% overvalued on this measure.
This model is only one lens, but on this cash flow view Huntsman does not screen as a bargain at current levels.
Result: OVERVALUED
Our Discounted Cash Flow (DCF) analysis suggests Huntsman may be overvalued by 33.2%. Discover 55 high quality undervalued stocks or create your own screener to find better value opportunities.
Approach 2: Huntsman Price vs Sales
For a business like Huntsman, which is being assessed using sales based metrics, the P/S ratio is a useful cross check because it compares what the market is paying for each dollar of revenue, rather than focusing on earnings that can swing with margins or one off items.
A “normal” or “fair” P/S ratio usually reflects what investors are willing to pay for a company’s growth outlook and risk profile. Higher expected growth and lower perceived risk often support a higher multiple, while slower growth or higher risk typically align with a lower one.
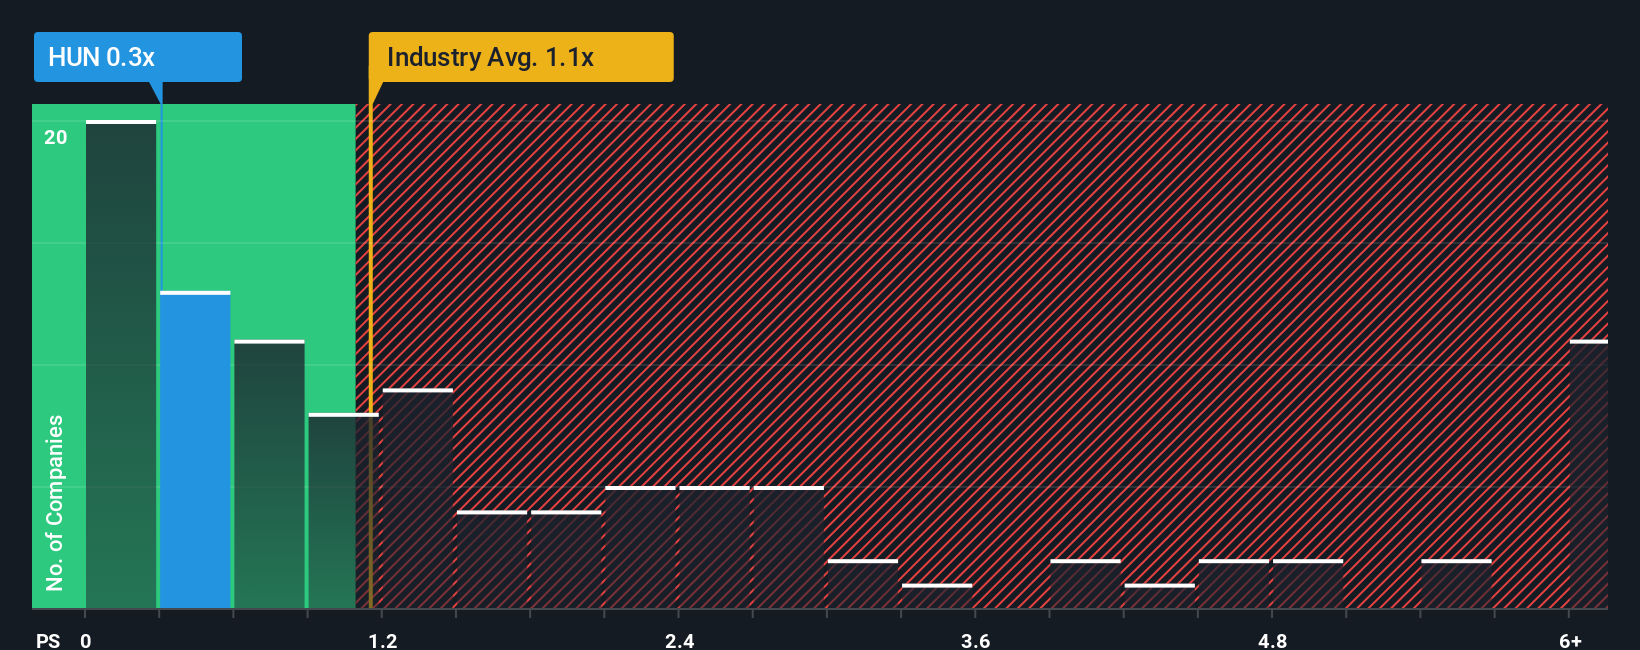
Huntsman currently trades on a P/S ratio of 0.40x, compared with the Chemicals industry average of 1.20x and a peer group average of 1.32x. Simply Wall St also calculates a proprietary “Fair Ratio” for Huntsman of 0.77x, which is the P/S multiple it might trade on given factors like its earnings growth, industry, profit margin, market cap and risk profile.
This Fair Ratio can be more informative than a simple peer or industry comparison because it adjusts for company specific traits rather than assuming all firms deserve the same multiple. With Huntsman at 0.40x versus a Fair Ratio of 0.77x, the shares appear undervalued on this metric.
Result: UNDERVALUED
P/S ratios tell one story, but what if the real opportunity lies elsewhere? Start investing in legacies, not executives. Discover our 23 top founder-led companies.
Upgrade Your Decision Making: Choose your Huntsman Narrative
Earlier we mentioned that there is an even better way to understand valuation. On Simply Wall St's Community page you can use Narratives, which let you turn your view of Huntsman into a clear story linked to specific forecasts for revenue, earnings and margins. You can connect that story to a fair value, compare that fair value with the current price to help decide whether to buy or sell, and then see it update automatically when fresh information like news or earnings arrives. For example, one investor might lean toward the higher US$20 price target with assumptions similar to the more optimistic case that points to a Fair Value near US$14. Another might align with the US$9 low target and a Fair Value around US$7. Narratives simply lay those different Huntsman stories side by side so you can decide which one matches your own expectations.
For Huntsman, however, we will make it really easy for you with previews of two leading Huntsman Narratives:
Fair value in this narrative: US$14.00 per share
Current price vs this fair value: about 5.6% below the narrative fair value
Revenue growth assumption: 5.73% a year
- Backers of this view focus on cost cuts, portfolio simplification and tighter inventory management as foundations for stronger and more resilient cash generation over time.
- They lean on analyst expectations for higher MDI pricing, a potential rebound in construction and auto demand, and steady growth in energy efficient building products and advanced materials.
- They also highlight Huntsman’s push into higher value Asian markets and specialty applications, while flagging that debt, regulation and commodity exposure still matter as risks to this thesis.
Fair value in this narrative: US$9.62 per share
Current price vs this fair value: about 37.3% above the narrative fair value
Revenue growth assumption: 2.91% a year
- This view stresses that overcapacity in MDI and polyurethanes, especially from overseas producers, keeps pricing and utilization under pressure and makes earnings recovery harder.
- It points to higher costs in Europe, soft construction and housing demand, and volatile input prices as reasons why margins and cash flow could stay fragile.
- Supporters of this narrative also watch dividend risk and say that, at recent prices, the stock already reflects much of the upside that more cautious analysts are willing to assume.
If you want to go beyond these summaries, the full Community Narratives set the numbers, risks and fair values for Huntsman side by side so you can align the story with your own expectations before you act.
Do you think there's more to the story for Huntsman? Head over to our Community to see what others are saying!
This article by Simply Wall St is general in nature. We provide commentary based on historical data and analyst forecasts only using an unbiased methodology and our articles are not intended to be financial advice. It does not constitute a recommendation to buy or sell any stock, and does not take account of your objectives, or your financial situation. We aim to bring you long-term focused analysis driven by fundamental data. Note that our analysis may not factor in the latest price-sensitive company announcements or qualitative material. Simply Wall St has no position in any stocks mentioned.