Is It Time To Reassess Airbnb (ABNB) After Recent Share Price Declines
Airbnb, Inc. ABNB | 137.46 | -0.04% |
- If you are wondering whether Airbnb's share price reflects its long term potential or if the market is mispricing it right now, this article will walk through the numbers in a clear, valuation focused way.
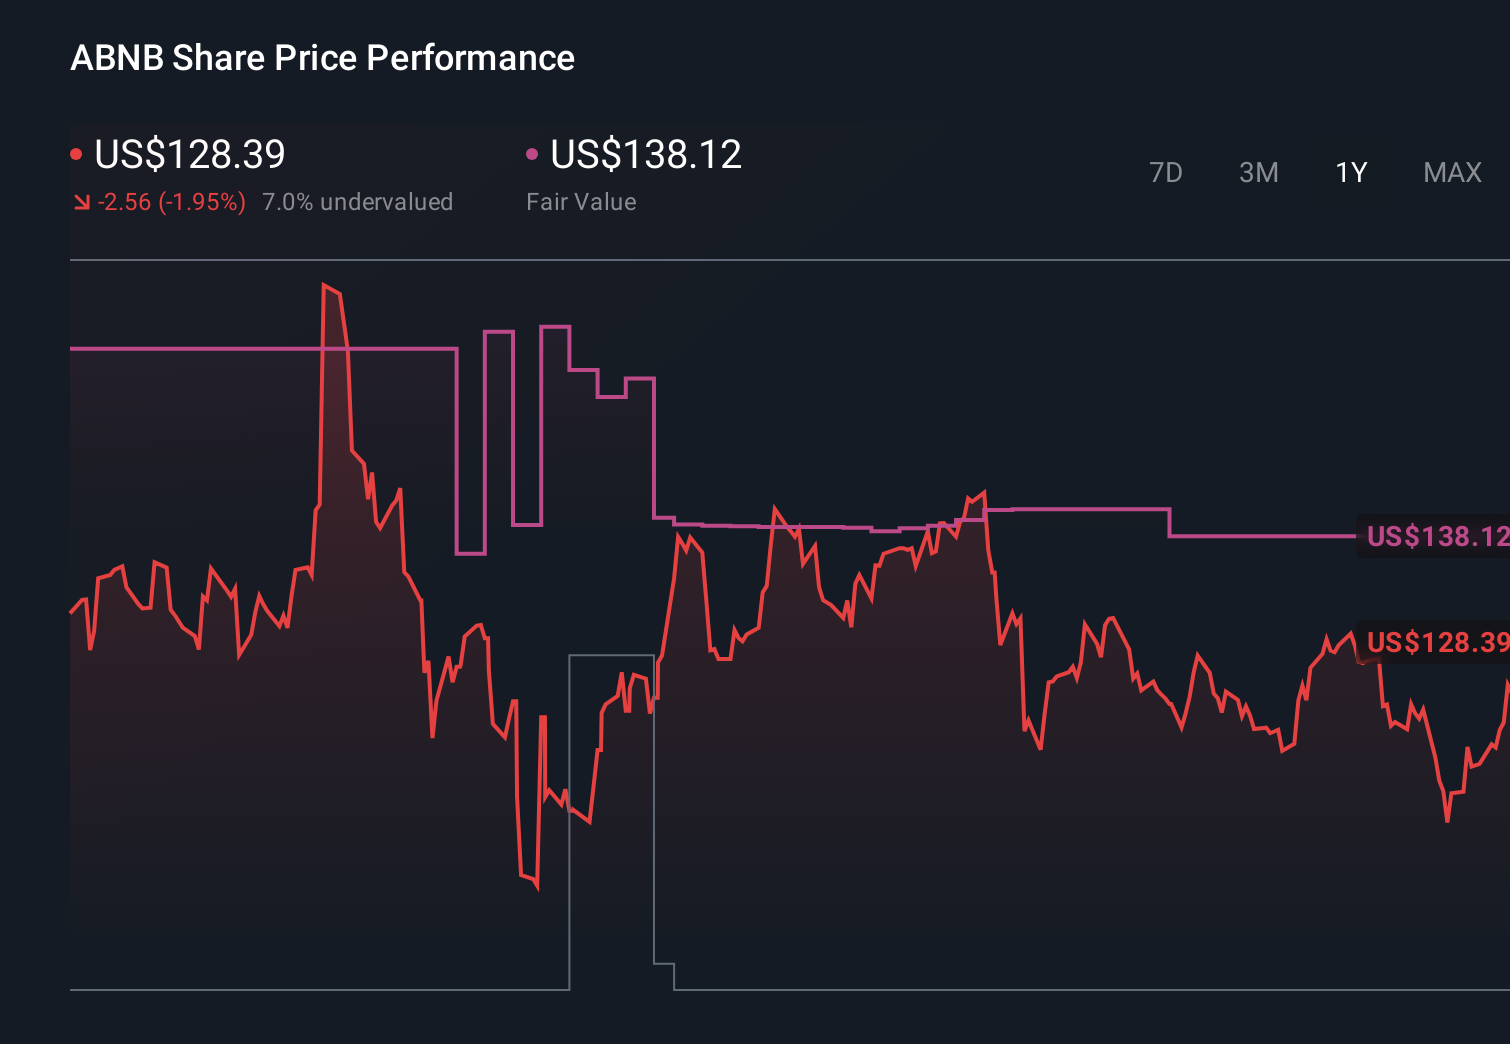
- Airbnb recently closed at US$121.27, with returns of an 8.0% decline over the past week, a 12.1% decline over the past month, and an 8.8% decline year to date, while the 1 year return sits at an 8.5% decline and the 5 year return at a 44.1% decline.
- These moves have come as investors continue to reassess large consumer services platforms and how they are priced relative to broader markets and alternative travel options. With that context, many readers are now looking more closely at Airbnb's underlying value rather than just watching the share price screen.
- Simply Wall St currently assigns Airbnb a valuation score of 4 out of 6, indicating it screens as undervalued on most of the checks used. Next, we will walk through the key valuation approaches that sit behind this, before finishing with a different way of thinking about value that could be even more useful.
Approach 1: Airbnb Discounted Cash Flow (DCF) Analysis
A Discounted Cash Flow, or DCF, model estimates what a business could be worth today by projecting its future cash flows and then discounting those back to a present value.
For Airbnb, the model used is a 2 Stage Free Cash Flow to Equity approach, based on cash flow projections in US$. The latest twelve month free cash flow sits at about $4.6b. Analysts provide explicit forecasts for several years, and Simply Wall St then extrapolates those out, with projected free cash flow of $7.7b by 2030.
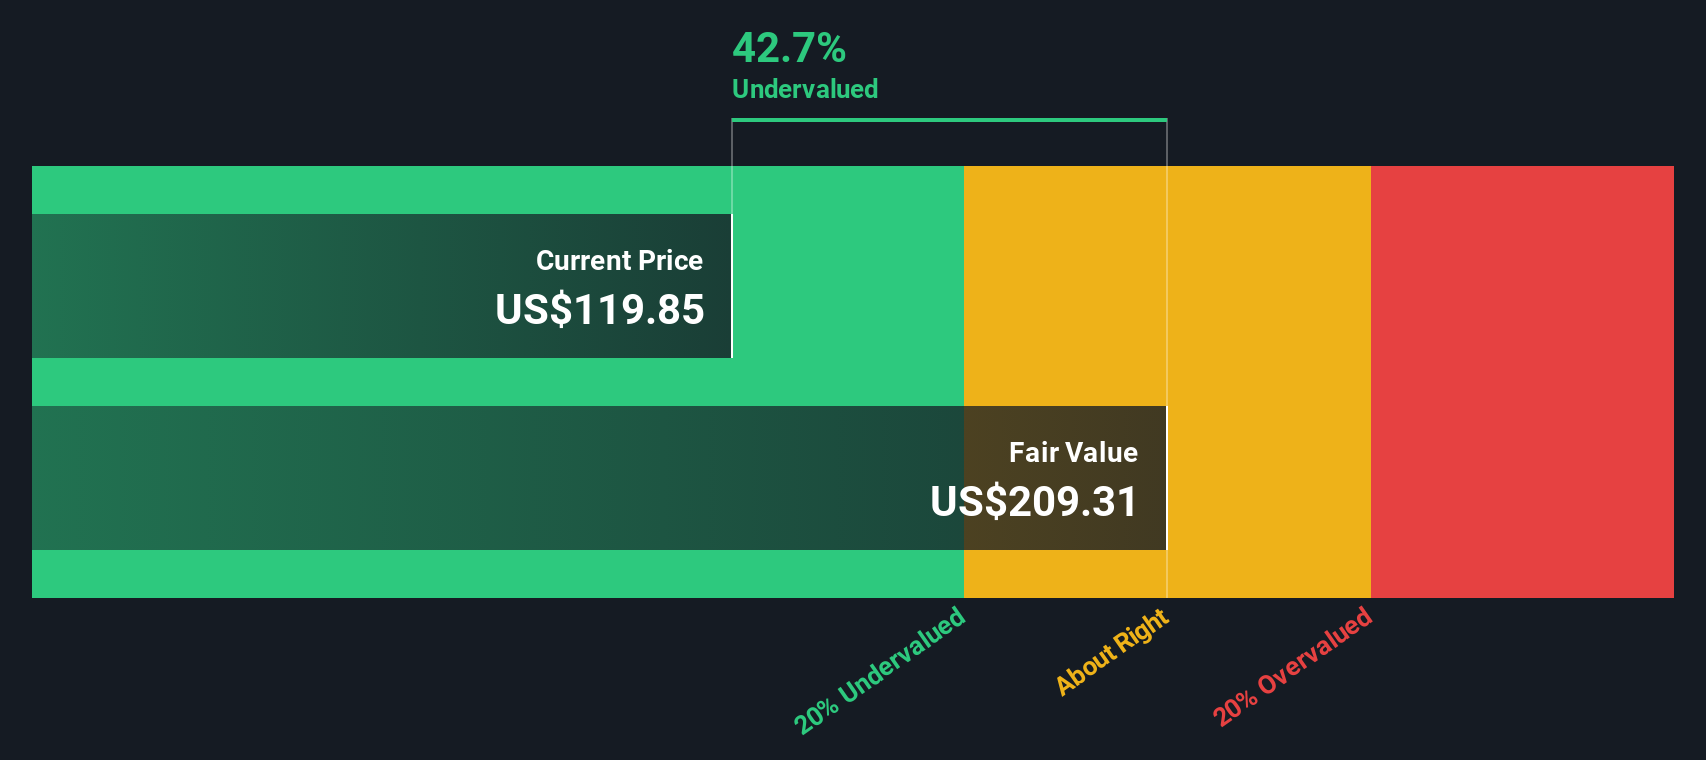
Those annual free cash flows from 2026 through 2035 are discounted back to today and summed. That exercise results in an estimated intrinsic value of about US$211.54 per share under the current set of assumptions.
Compared with the recent share price of US$121.27, the model implies the stock trades at a 42.7% discount to this estimate, which screens as materially undervalued on this method.
Result: UNDERVALUED
Our Discounted Cash Flow (DCF) analysis suggests Airbnb is undervalued by 42.7%. Track this in your watchlist or portfolio, or discover 55 more high quality undervalued stocks.
Approach 2: Airbnb Price vs Earnings
For profitable companies, the P/E ratio is a useful way to link what you pay per share to the earnings the business is currently generating. Investors usually accept a higher P/E if they expect stronger growth or see the earnings as relatively resilient, while slower growth or higher perceived risk tends to justify a lower, more conservative P/E.
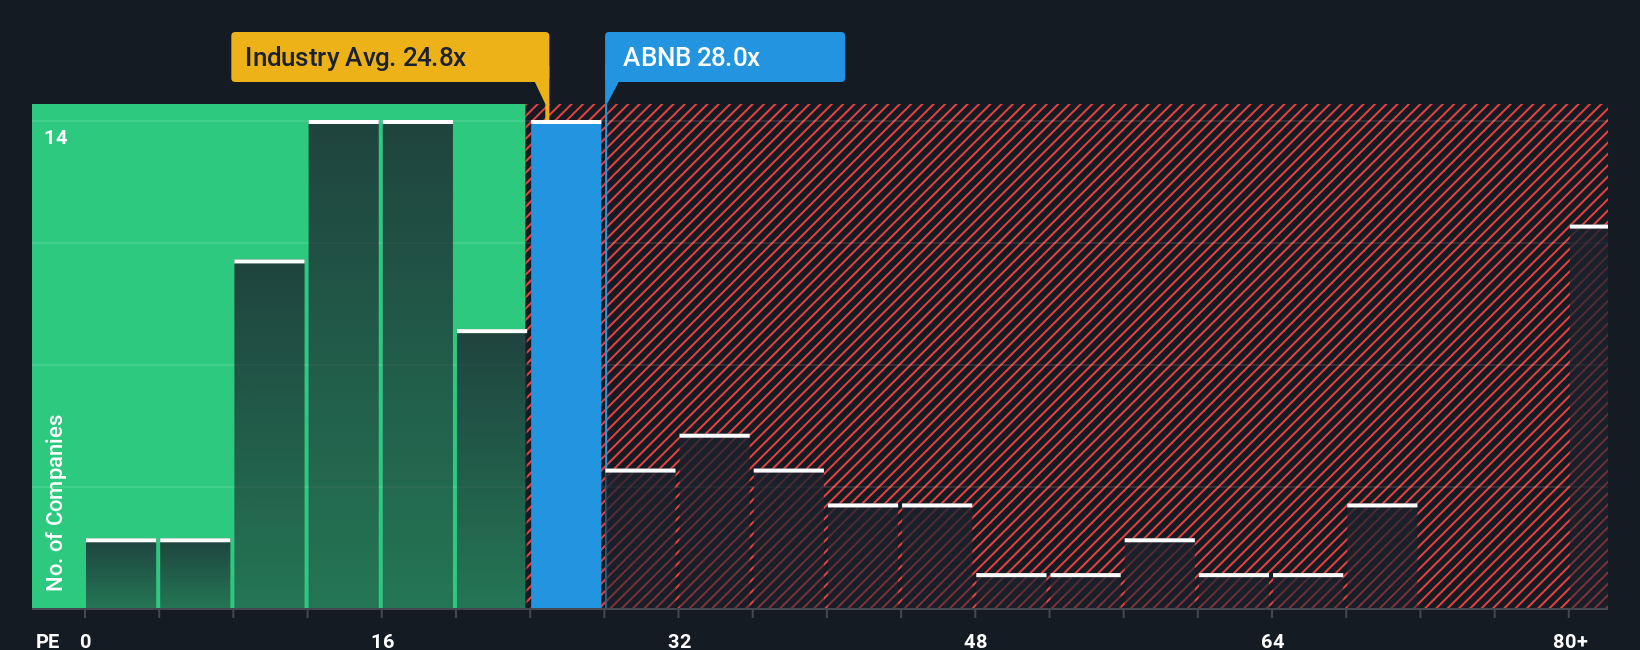
Airbnb currently trades on a P/E of 27.95x. That sits above the Hospitality industry average of 21.00x, but below the peer group average of 31.43x. Simply Wall St also calculates a proprietary “Fair Ratio” for Airbnb of 30.44x, which is the P/E level that would typically line up with its earnings growth profile, profit margins, industry, market cap and specific risks.
This Fair Ratio is often more useful than a simple comparison with peers or the broad industry, because it adjusts for how different Airbnb is from a typical Hospitality company on factors like growth, risk and profitability. Comparing the Fair Ratio of 30.44x with the current P/E of 27.95x suggests the shares are trading below this customised benchmark, which indicates the stock appears undervalued on this metric.
Result: UNDERVALUED
P/E ratios tell one story, but what if the real opportunity lies elsewhere? Start investing in legacies, not executives. Discover our 22 top founder-led companies.
Upgrade Your Decision Making: Choose your Airbnb Narrative
Earlier we mentioned that there is an even better way to understand valuation, so let us introduce you to Narratives, a simple way to connect the story you believe about Airbnb to the numbers on the screen.
A Narrative is your own clear storyline for a company that sits behind the data, where you spell out what you think is a reasonable fair value, how revenue, earnings and margins might develop, and why that makes sense to you.
On Simply Wall St, Narratives live inside the Community page. There you can quickly link Airbnb’s story to a forecast and then to a fair value estimate, compare that fair value to the current price, and decide whether you see the stock as a potential buy, sell or hold.
These Narratives update automatically when new information such as earnings releases or major news is added. This means your view of Airbnb’s value can stay aligned with the latest data without you rebuilding a spreadsheet every time.
For Airbnb, one investor might set a relatively low fair value with cautious revenue and margin assumptions, while another might use much higher revenue growth and profitability expectations, leading to a far higher fair value even though both are using the same company and the same data source.
Do you think there's more to the story for Airbnb? Head over to our Community to see what others are saying!
This article by Simply Wall St is general in nature. We provide commentary based on historical data and analyst forecasts only using an unbiased methodology and our articles are not intended to be financial advice. It does not constitute a recommendation to buy or sell any stock, and does not take account of your objectives, or your financial situation. We aim to bring you long-term focused analysis driven by fundamental data. Note that our analysis may not factor in the latest price-sensitive company announcements or qualitative material. Simply Wall St has no position in any stocks mentioned.