Is It Time To Reassess Amazon.com (AMZN) After Its Strong Multi Year Share Price Run?
Amazon.com, Inc. AMZN | 0.00 |
- If you are wondering whether Amazon.com shares are offering good value at current levels, it helps to strip away the noise and focus on what the numbers actually say.
- The stock recently closed at US$250.56, with returns of 5.1% over 7 days, 19.4% over 30 days, 10.6% year to date, 45.2% over 1 year and 134.3% over 3 years. This naturally raises questions about how much of this performance is already reflected in the price.
- Recent headlines have focused on Amazon.com's ongoing investment in its retail and cloud businesses and its role in broader trends in e commerce and digital services. This context helps frame why investors are closely watching the balance between growth expectations, execution risks and what they are paying for the stock.
- Right now, Amazon.com has a valuation score of 2 out of 6. The key question is how different valuation approaches interpret that score and whether a more complete framework, introduced at the end of this article, can give you a clearer view of what the shares might be worth.
Amazon.com scores just 2/6 on our valuation checks. See what other red flags we found in the full valuation breakdown.
Approach 1: Amazon.com Discounted Cash Flow (DCF) Analysis
A Discounted Cash Flow model takes estimates of a company’s future cash flows and discounts them back to today using a required rate of return, aiming to translate all those future dollars into a single present value per share.
For Amazon.com, the model uses last twelve months Free Cash Flow of about $40.1b as a starting point. Analysts provide explicit forecasts for several years, and Simply Wall St then extrapolates further using a 2 Stage Free Cash Flow to Equity approach. Under this framework, projected Free Cash Flow for 2030 is $141.3b, with interim years ranging from a forecast outflow in 2026 of $20.6b to progressively larger inflows in later years.
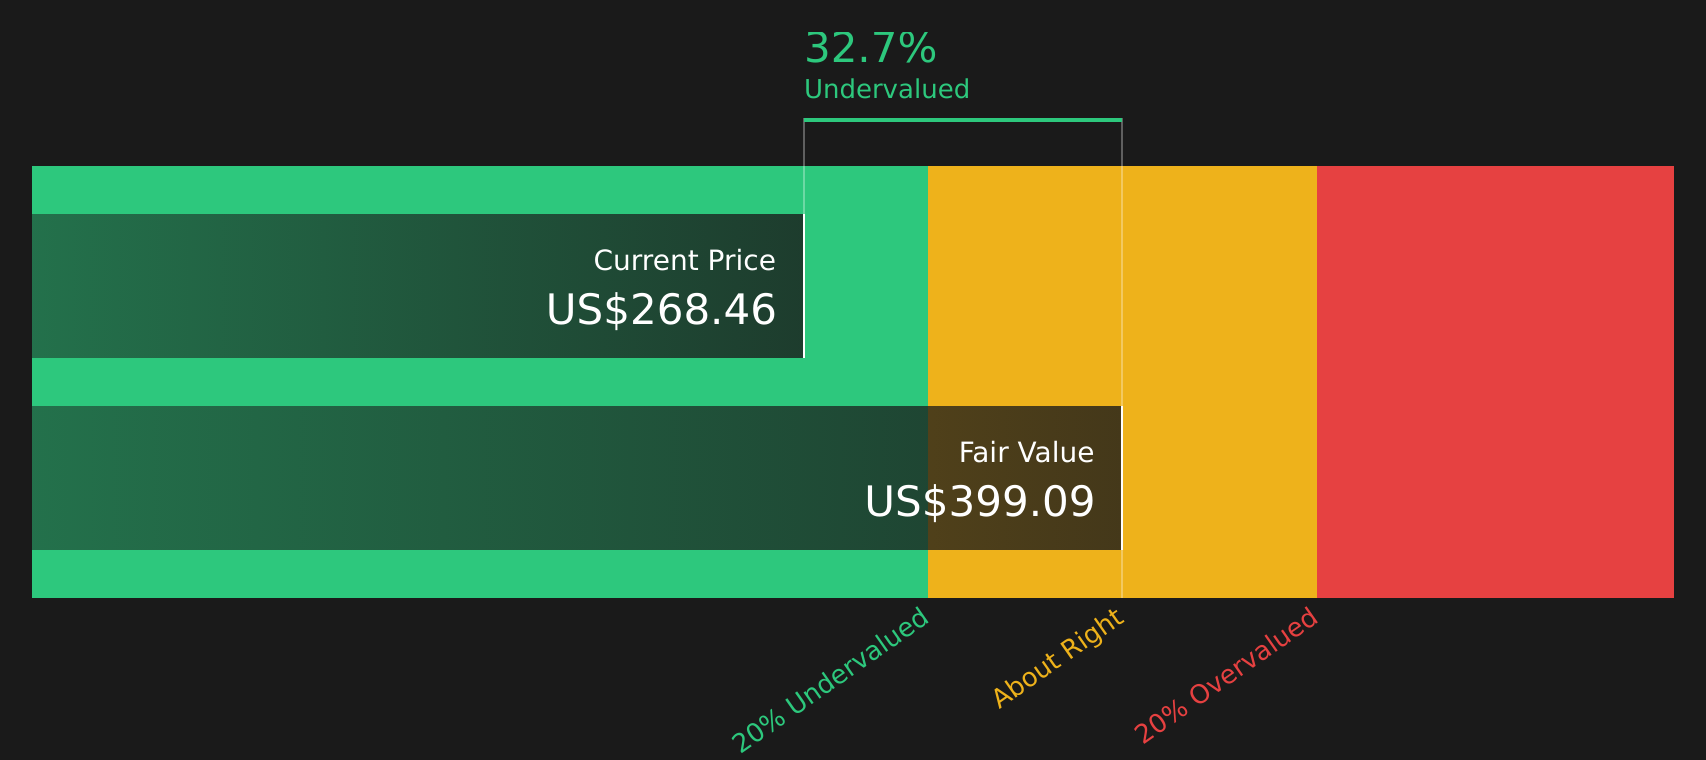
When all these projected cash flows are discounted back and summed, the model arrives at an estimated intrinsic value of US$297.89 per share. Compared with the recent share price of US$250.56, this implies an intrinsic discount of 15.9% based on this DCF view.
Result: UNDERVALUED
Our Discounted Cash Flow (DCF) analysis suggests Amazon.com is undervalued by 15.9%. Track this in your watchlist or portfolio, or discover 59 more high quality undervalued stocks.
Approach 2: Amazon.com Price vs Earnings
For profitable companies, the P/E ratio is a straightforward way to connect what you pay for each share with the earnings that back it. It helps you see how many dollars of price the market is attaching to each dollar of profit.
What counts as a “normal” P/E comes down to what investors expect for future growth and how much risk they see in those earnings. Higher growth and lower perceived risk usually justify a higher multiple, while slower or less predictable earnings tend to warrant a lower one.
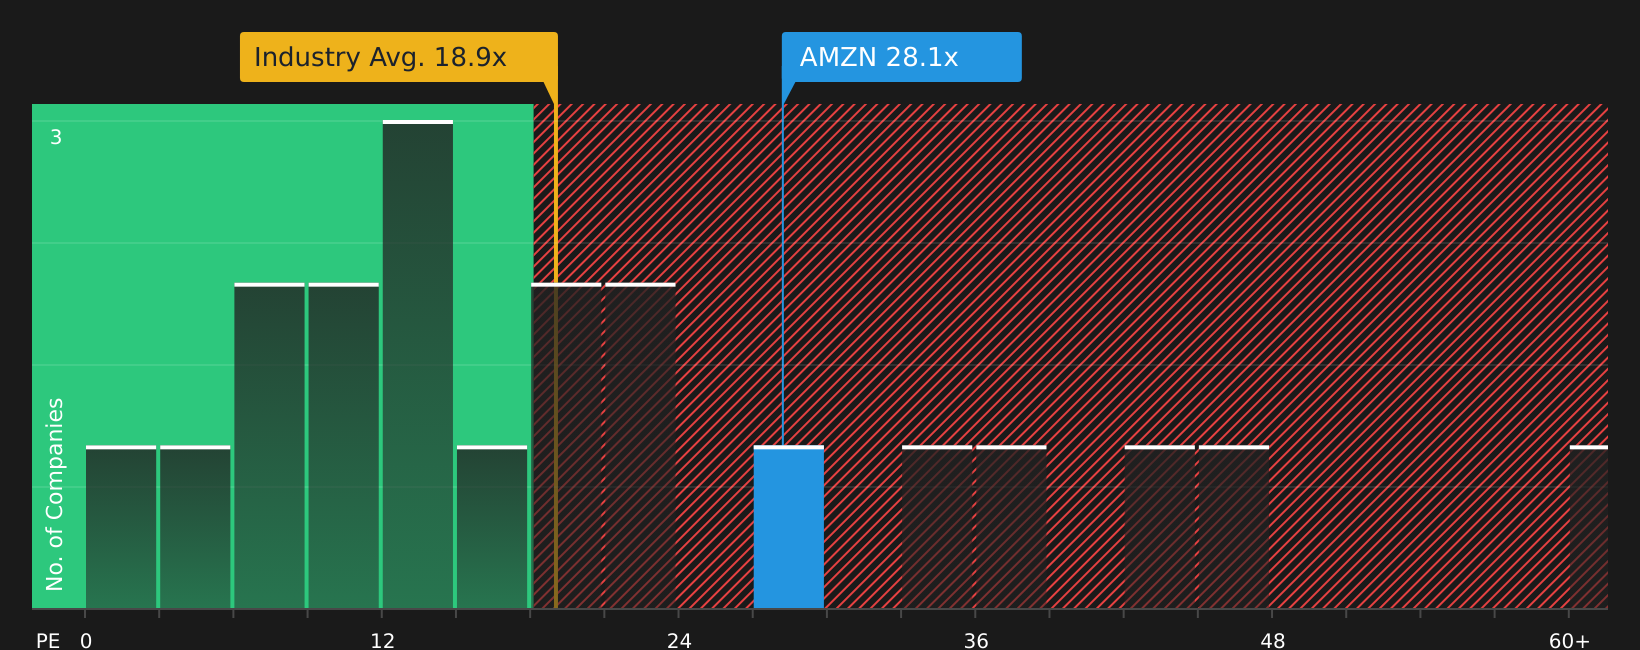
Amazon.com currently trades on a P/E of 34.69x, compared with the Multiline Retail industry average of 21.95x and a peer average of 28.70x. Simply Wall St’s Fair Ratio for Amazon.com is 39.38x. This Fair Ratio is a proprietary estimate of what P/E might make sense given the company’s earnings growth profile, industry, profit margins, market cap and risk characteristics.
Because the Fair Ratio anchors the P/E to company specific drivers rather than broad group averages, it can be more tailored than a simple comparison with peers or the wider industry. With Amazon.com’s current P/E below the Fair Ratio, the shares screen as undervalued on this metric.
Result: UNDERVALUED
P/E ratios tell one story, but what if the real opportunity lies elsewhere? Start investing in legacies, not executives. Discover our 19 top founder-led companies.
Upgrade Your Decision Making: Choose your Amazon.com Narrative
Earlier we mentioned that there is an even better way to understand valuation, so this is where Narratives come in as a simple way for you to pair a clear story about Amazon.com with your own numbers on future revenue, earnings, margins and fair value.
A Narrative is your view of what drives Amazon.com, written as a short story that sits on top of a set of assumptions. Instead of just accepting a single DCF or P/E output, you connect the business you think Amazon.com is building to a financial forecast and then to a fair value per share.
On Simply Wall St, Narratives are easy to use, live inside the Community page and are already created by millions of investors. This means you can pick one that fits you or adjust the assumptions yourself, then see a live Fair Value and compare it directly with today’s share price to consider whether the stock looks expensive or cheap on your terms.
These Narratives update automatically when new earnings, news or analyst forecasts arrive, so your fair value view moves with the information rather than staying frozen. You can also see how different investors interpret the same stock, from a cautious Amazon.com view at a fair value of about US$141 to a much more optimistic Narrative closer to US$500.
For Amazon.com however we will make it really easy for you with previews of two leading Amazon.com Narratives:
Fair value: US$450.00 per share
Implied undervaluation vs last close: 44.3%
Revenue growth used in this Narrative: 8.95%
- The author argues that Amazon is intentionally keeping margins lower in the near term to fund large AI, cloud and automation projects that are expected to lift earnings power later on.
- AWS, advertising and more efficient retail operations are presented as the main profit engines, with AI tools and custom chips aimed at locking in enterprise customers.
- The Narrative frames the current share price as not fully reflecting potential future operating income if margins and mix shift play out as expected.
Fair value: US$222.55 per share
Implied overvaluation vs last close: 12.6%
Revenue growth used in this Narrative: 15.19%
- This author focuses on how online retail, third party sellers, AWS and advertising could support higher earnings power, but also highlights that heavy reinvestment may keep free cash flow muted for some time.
- The Narrative lays out detailed segment assumptions on revenue mix and margins, with particular attention to the role of AWS and advertising in overall profitability.
- Based on those assumptions, the indicated fair value sits below the current share price, so the stock screens as fully valued or richer than the author’s estimate.
If you want to see how other investors are connecting their stories and numbers on Amazon.com, you can review more Narratives, compare their fair values and decide which assumptions best line up with your own expectations.
Do you think there's more to the story for Amazon.com? Head over to our Community to see what others are saying!

This article by Simply Wall St is general in nature. We provide commentary based on historical data and analyst forecasts only using an unbiased methodology and our articles are not intended to be financial advice. It does not constitute a recommendation to buy or sell any stock, and does not take account of your objectives, or your financial situation. We aim to bring you long-term focused analysis driven by fundamental data. Note that our analysis may not factor in the latest price-sensitive company announcements or qualitative material. Simply Wall St has no position in any stocks mentioned.