Is It Time To Reassess Amazon.com (AMZN) After Its Strong Share Price Rally?
Amazon.com, Inc. AMZN | 0.00 |
- If you have ever wondered whether Amazon.com at US$271.17 is priced for its future potential or already reflects a lot of optimism, this article is for you.
- The stock has returned 2.3% over the last 7 days, 26.9% over the last 30 days, 19.7% year to date and 41.2% over the last year, with a 3 year return of 141.7% and 5 year return of 71.5%.
- Recent headlines have continued to focus on Amazon.com's scale in e-commerce and cloud infrastructure, as well as its ongoing investments in logistics and technology capabilities. These themes help frame how the recent share price moves may relate to expectations for future cash flows and competitive positioning.
- Amazon.com currently holds a valuation score of 3/6, and the rest of this article will break down what that means across different valuation approaches and point to a more complete way to think about value at the end.
Approach 1: Amazon.com Discounted Cash Flow (DCF) Analysis
A Discounted Cash Flow model projects a company’s future cash flows and then discounts them back to today’s value. It aims to estimate what the business could be worth based on those cash flows rather than just its current earnings or revenue.
For Amazon.com, the model uses last twelve month Free Cash Flow of about $37.13b and a 2 Stage Free Cash Flow to Equity approach based on cash flow projections. Analyst inputs cover the nearer years and Simply Wall St extrapolates further out, with projected Free Cash Flow for 2030 of about $175.95b. This is accompanied by a series of projections between 2026 and 2035 that are discounted back to today using the model’s required return assumptions.
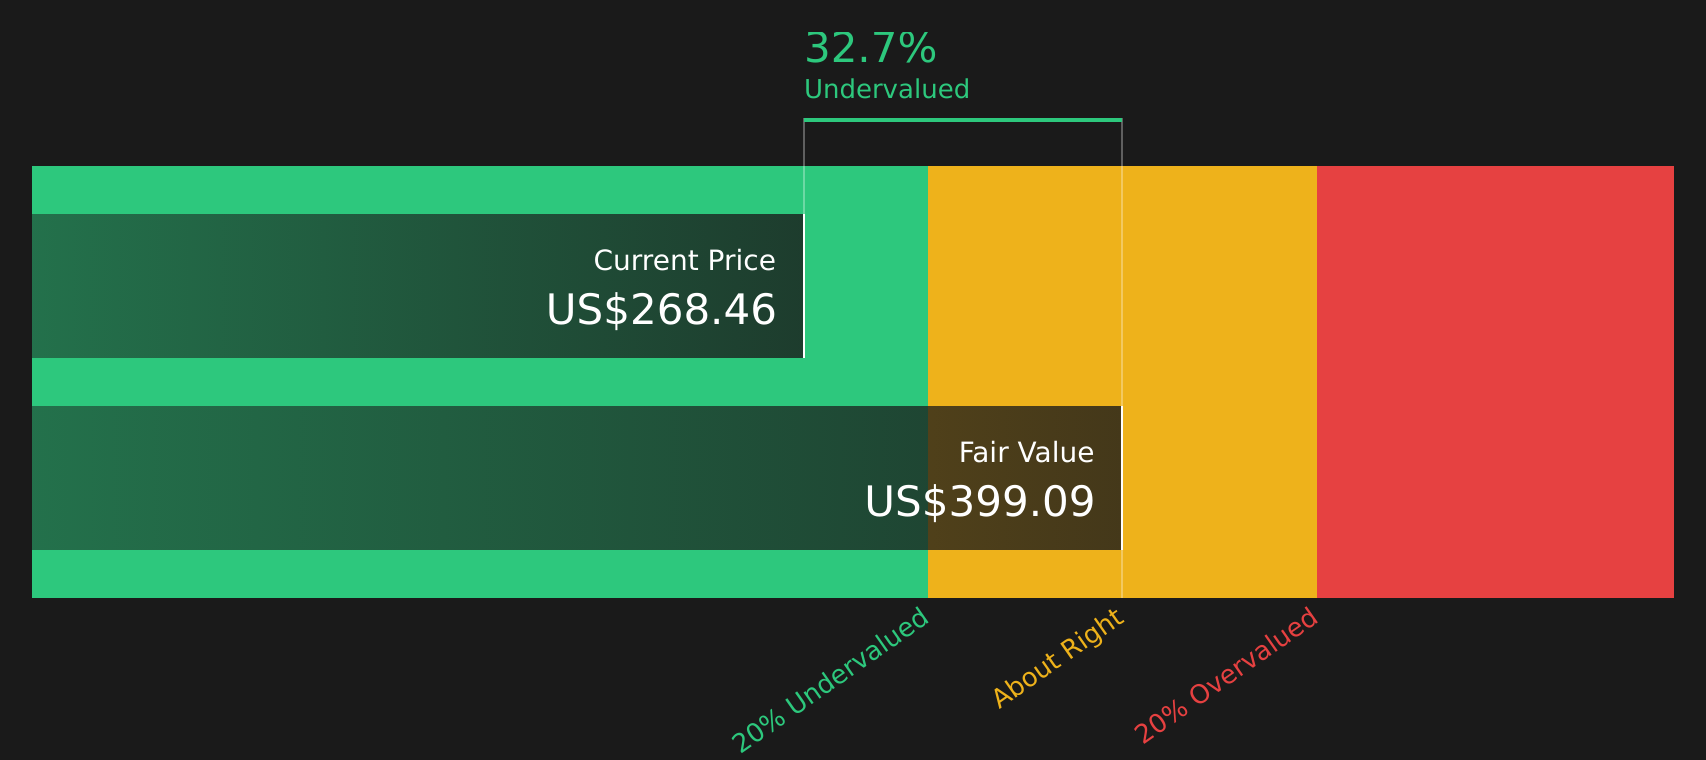
When these discounted cash flows are added up, the estimated intrinsic value from this DCF is about $398.72 per share. Compared to the current share price of US$271.17, this implies the stock is around 32.0% below that intrinsic estimate, which suggests Amazon.com may be undervalued according to this specific cash flow model.
Result: UNDERVALUED
Our Discounted Cash Flow (DCF) analysis suggests Amazon.com is undervalued by 32.0%. Track this in your watchlist or portfolio, or discover 51 more high quality undervalued stocks.
Approach 2: Amazon.com Price vs Earnings
For a profitable company, the P/E ratio is a useful way to think about what you are paying for each dollar of earnings. Higher P/E ratios tend to be associated with higher expected growth and lower perceived risk, while lower P/E ratios can point to more modest growth expectations or higher risk.
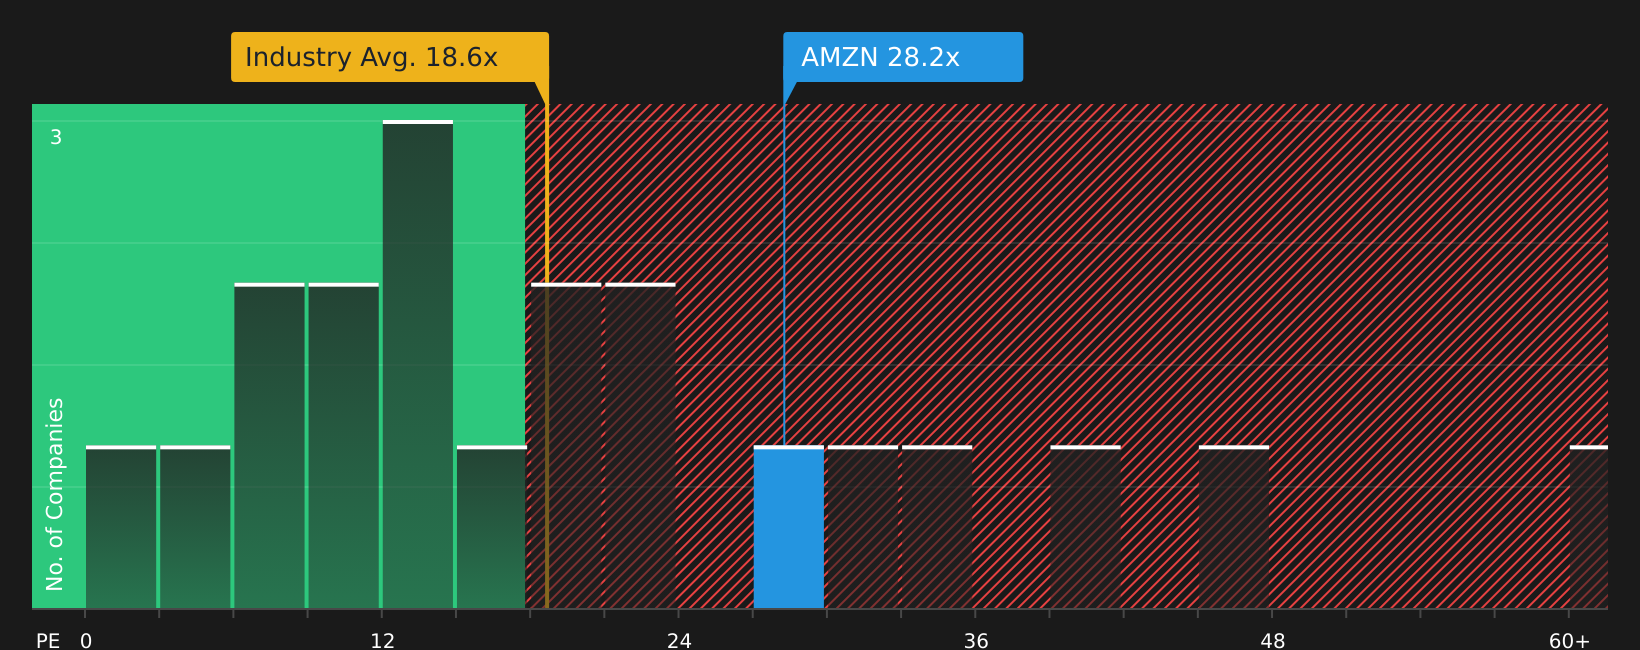
Amazon.com currently trades on a P/E of 32.13x. This sits above the Multiline Retail industry average P/E of 19.39x and also above the peer group average of 28.78x, which suggests the market is willing to pay more for each dollar of Amazon.com's earnings than for many sector peers.
Simply Wall St's Fair Ratio for Amazon.com is 41.78x. This is a proprietary estimate of what a "normal" P/E could look like for the company, based on factors such as earnings growth, industry, profit margins, market capitalization and risk profile. Because it adjusts for these company specific characteristics, the Fair Ratio can offer a more tailored yardstick than simple comparisons with peers or the broad industry.
Comparing the current P/E of 32.13x with the Fair Ratio of 41.78x suggests the stock is trading below that fair multiple on this measure.
Result: UNDERVALUED
P/E ratios tell one story, but what if the real opportunity lies elsewhere? Start investing in legacies, not executives. Discover our 19 top founder-led companies.
Upgrade Your Decision Making: Choose your Amazon.com Narrative
Earlier we mentioned that there is an even better way to understand valuation. This is where Narratives come in: a simple way for you to attach a clear story about Amazon.com to the numbers you think are reasonable for its future revenue, earnings, margins and fair value.
A Narrative links three pieces together: your view of the business, a matching financial forecast, and a resulting fair value. Instead of just looking at a P/E or DCF output, you see how your assumptions about AWS, advertising, logistics or AI driven efficiency add up to a price that you can compare with today’s US$271.17.
On Simply Wall St, Narratives sit inside the Community page and are easy to use. You can pick an existing Amazon.com view, such as one that uses a fair value of US$151.21 at a 7% revenue growth rate and 10% margin, or another that assumes US$450.00 fair value with 8.95% growth and 9% margin, then see in one place how those different stories translate to very different fair values relative to the current price.
Because Narratives are updated automatically when new earnings, news or analyst estimates arrive, your Amazon.com view stays current and you can quickly see when your fair value has moved closer to or further from the market price. This can help you decide whether it may be time to act or wait.
For Amazon.com however we will make it really easy for you with previews of two leading Amazon.com Narratives:
These sit at opposite ends of the valuation debate and give you a clear sense of how different assumptions on growth, margins and reinvestment can lead to very different fair values relative to the current US$271.17 share price.
Fair value in this narrative: US$450.00 per share
Implied discount to this fair value: 39.7% below the narrative estimate
Revenue growth assumption: 8.95%
- Frames Amazon.com as materially misunderstood, with intentional margin pressure today to fund large AI, cloud and automation investments that are expected to support higher earnings capacity later on.
- Highlights AWS, advertising and a more efficient retail operation as the main profit engines, with AI tools, custom chips and logistics automation used to support those segments.
- Argues that current margins reflect an investment phase and that, as those investments are absorbed, earnings power could support the US$450.00 per share fair value used in the model.
Fair value in this narrative: US$222.55 per share
Implied premium to this fair value: 21.8% above the narrative estimate
Revenue growth assumption: 15.19%
- Focuses on how Amazon.com’s reported profits may understate its earnings capacity, but also on how ongoing reinvestment can keep free cash flow muted for some time.
- Breaks the business into online stores, third party sellers, AWS, advertising, subscriptions and physical stores, and assigns segment level growth and margin assumptions to build up future operating cash flow.
- Emphasizes that regulatory pressure, economic slowdowns and heavy capital expenditure could affect how quickly those cash flows show through, which is why this narrative anchors on a lower US$222.55 fair value.
If you want to see how other investors are joining these dots for Amazon.com and how their stories translate into different fair values, it is worth reviewing the full range of Community Narratives and tracking how the assumptions evolve over time.
To see how these results tie into long-term growth, risks, and valuation, check out the full range of community narratives for Amazon.com on Simply Wall St. Add the company to your watchlist or portfolio so you'll be alerted when the story evolves.
Do you think there's more to the story for Amazon.com? Head over to our Community to see what others are saying!

This article by Simply Wall St is general in nature. We provide commentary based on historical data and analyst forecasts only using an unbiased methodology and our articles are not intended to be financial advice. It does not constitute a recommendation to buy or sell any stock, and does not take account of your objectives, or your financial situation. We aim to bring you long-term focused analysis driven by fundamental data. Note that our analysis may not factor in the latest price-sensitive company announcements or qualitative material. Simply Wall St has no position in any stocks mentioned.