Is It Time To Reassess Amazon.com (AMZN) After Strong Multi‑Year Share Price Gains?
Amazon.com, Inc. AMZN | 0.00 |
- Investors may be wondering whether Amazon.com stock still offers value after a long run in the spotlight, or if expectations already do the heavy lifting for the current price.
- The stock last closed at US$264.14, with returns of 6.3% over the past month, 16.6% year to date and 28.5% over the past year, while the return over the last 7 days declined 3.1%.
- Recent headlines have focused on Amazon.com's expansion across its retail and cloud businesses as well as the continued build out of services that sit on top of its core platform. Together with the 127.2% return over 3 years and 64.9% return over 5 years, that context helps explain why investors are closely watching what they are paying for each future dollar of cash flow.
- Simply Wall St currently gives Amazon.com a value score of 3 out of 6. The rest of this article will walk through how different valuation approaches line up, before finishing with a broader way to think about what that score really means for you as a shareholder.
Approach 1: Amazon.com Discounted Cash Flow (DCF) Analysis
A Discounted Cash Flow, or DCF, model looks at the cash Amazon.com is expected to generate in the future and then discounts those projected cash flows back to today to estimate what the stock could be worth right now.
Amazon.com currently reports last twelve month free cash flow of about $37.1b. Analysts and Simply Wall St projections suggest this could reach around $175.9b in 2030, with a detailed 2 Stage Free Cash Flow to Equity model mapping out annual cash flow estimates between 2026 and 2035, some of which are analyst based and some extrapolated.
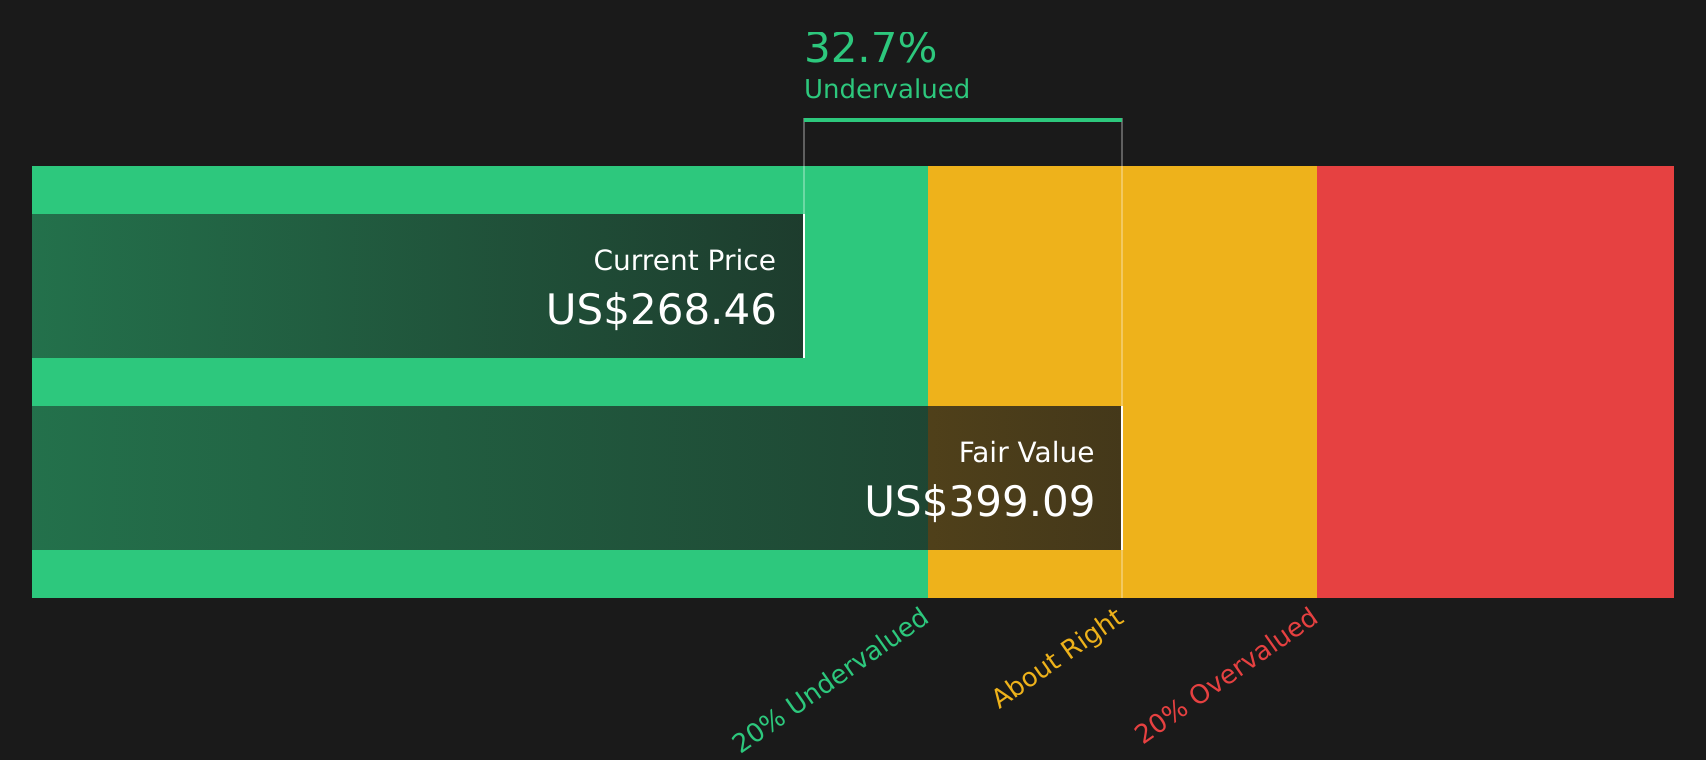
Bringing all those projected cash flows back to today results in an estimated intrinsic value of about $399.82 per share. Compared with the recent share price of $264.14, the DCF output points to an implied discount of 33.9%. This indicates that, on this model alone, the stock appears to be undervalued.
Result: UNDERVALUED
Our Discounted Cash Flow (DCF) analysis suggests Amazon.com is undervalued by 33.9%. Track this in your watchlist or portfolio, or discover 50 more high quality undervalued stocks.
Approach 2: Amazon.com Price vs Earnings
For profitable companies like Amazon.com, the P/E ratio is a useful way to check what you are paying for each dollar of earnings, because it links the share price directly to the company’s current profit stream.
What counts as a “normal” P/E depends on how quickly earnings are expected to grow and how risky those earnings are. Higher expected growth or lower perceived risk can justify a higher P/E, while slower growth or higher risk usually lines up with a lower multiple.
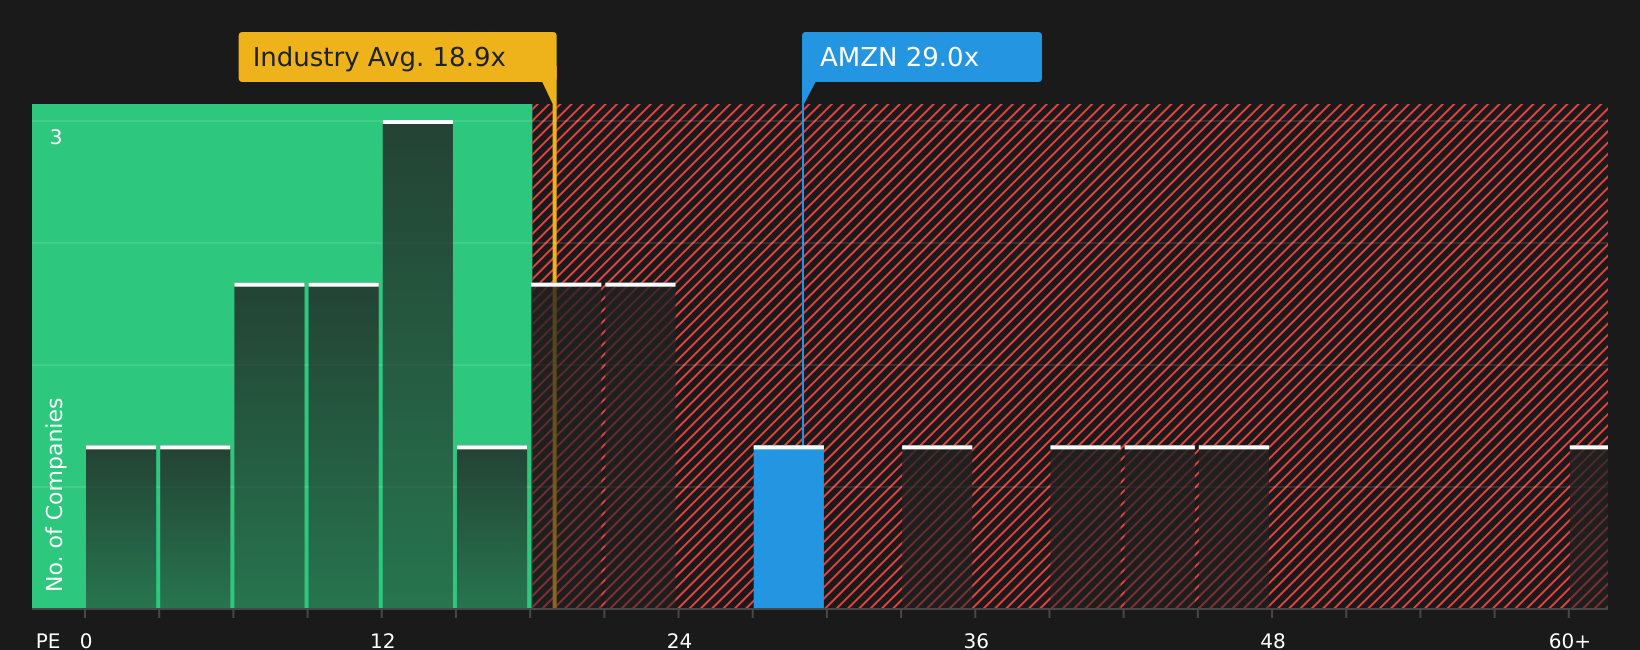
Amazon.com currently trades on a P/E of 31.29x. That is above both the Multiline Retail industry average P/E of 19.31x and the peer group average of 25.88x. This suggests the market is willing to pay a premium compared with many competitors.
Simply Wall St’s Fair Ratio for Amazon.com is 41.45x. This is a proprietary estimate of what the P/E might be, given factors such as earnings growth, profit margins, industry, market cap and company specific risks. Because it blends these company level characteristics, the Fair Ratio can be more tailored than a simple comparison with peers or the sector.
Comparing Amazon.com’s actual P/E of 31.29x with the Fair Ratio of 41.45x indicates that, relative to this model-based yardstick, the stock is trading at a lower multiple.
Result: UNDERVALUED
P/E ratios tell one story, but what if the real opportunity lies elsewhere? Start investing in legacies, not executives. Discover our 19 top founder-led companies.
Upgrade Your Decision Making: Choose your Amazon.com Narrative
Earlier sections showed how DCFs and P/E multiples can give you point estimates, but Narratives let you go further by attaching your own story about Amazon.com to those numbers. This allows you to state what you think fair value is, along with your assumptions for future revenue, earnings and margins, and then see how that stacks up against the current share price.
On Simply Wall St, Narratives sit inside the Community page and are already used by millions of investors as an accessible tool that connects three things: the company story, a forward-looking forecast and an implied fair value. All of these update automatically as news, earnings or guidance change.
This means you can decide what to do by comparing fair value to price, rather than only reacting to headlines. For example, one Amazon.com Narrative on the platform currently points to a fair value of US$151.21, while another sits at US$500.00. These reflect very different views on AWS, AI investment and retail margins, yet both are transparently tied to explicit assumptions rather than gut feel.
For Amazon.com however we will make it really easy for you with previews of two leading Amazon.com Narratives:
These sit on opposite sides of the fair value debate, so you can see how different investors connect the same set of business drivers to very different conclusions.
Fair value: US$450.00 per share
Implied discount to this fair value: 41.3% based on the last close of US$264.14
Revenue growth assumption: 8.95%
- The bullish Narrative argues that current margin pressure is intentional, with heavy AI and infrastructure spending aimed at lifting Amazon's long term earnings capacity.
- AWS, advertising and more efficient retail operations are presented as the key engines that could support higher profitability as the investment phase peaks.
- At US$450 per share, the author sees the gap between reported margins and underlying earnings power as the core reason the stock is viewed as undervalued.
Fair value: US$222.55 per share
Implied premium to this fair value: 18.7% based on the last close of US$264.14
Revenue growth assumption: 15.19%
- The more cautious Narrative values Amazon below the current share price, even while assuming solid contributions from third party sellers, AWS and advertising.
- The author highlights that ongoing reinvestment and heavy capital spending could keep free cash flow lower than headline operating cash flow for some time.
- On this view, the stock already reflects much of the expected revenue and margin improvement, so the current price is framed as rich relative to the US$222.55 fair value estimate.
Together these Narratives show how two investors can look at the same company, agree on many business drivers and still reach very different views on what Amazon.com is worth today.
If you want to see how those arguments develop in full and how other investors are framing the trade off between price, growth and profitability, you can review the wider set of community Narratives next.
Do you think there's more to the story for Amazon.com? Head over to our Community to see what others are saying!

This article by Simply Wall St is general in nature. We provide commentary based on historical data and analyst forecasts only using an unbiased methodology and our articles are not intended to be financial advice. It does not constitute a recommendation to buy or sell any stock, and does not take account of your objectives, or your financial situation. We aim to bring you long-term focused analysis driven by fundamental data. Note that our analysis may not factor in the latest price-sensitive company announcements or qualitative material. Simply Wall St has no position in any stocks mentioned.