Is It Time To Reassess IBM (IBM) After Recent Share Price Swings?
IBM Corp IBM | 0.00 |
- If you are wondering whether International Business Machines at around US$277.49 is priced attractively or not, the next sections will walk through what its current valuation might be telling you.
- The stock has had a mixed run recently, with the share price down 15.7% over the last week, up 20.8% over the last month, slightly down 4.8% year to date, and up 3.0% over the last year. These shifts can change how investors think about both potential upside and risk.
- These price moves sit against a backdrop where investors are watching how established technology companies position themselves in areas like cloud, AI and IT services, and how that shapes expectations around long term cash generation. For a stock with a long history in enterprise technology, shifts in sentiment around these themes can quickly feed into valuation views.
- On Simply Wall St's 6 point valuation checklist, International Business Machines scores 3/6. The rest of this article will unpack what different valuation methods suggest about that score, before finishing with a broader way to think about what the valuation might really mean for you.
Approach 1: International Business Machines Discounted Cash Flow (DCF) Analysis
A Discounted Cash Flow, or DCF, model takes estimates of a company’s future cash flows and discounts them back to today’s value using a required rate of return. The idea is simple: a dollar of cash in the future is worth less than a dollar in your hand today.
For International Business Machines, the model used is a 2 Stage Free Cash Flow to Equity approach. The latest twelve month free cash flow is about $12.2b. Analyst estimates and subsequent extrapolations point to free cash flow of $21.8b in 2030, with a detailed path of projected cash flows between 2026 and 2035 that are discounted back to today to arrive at an equity value per share.
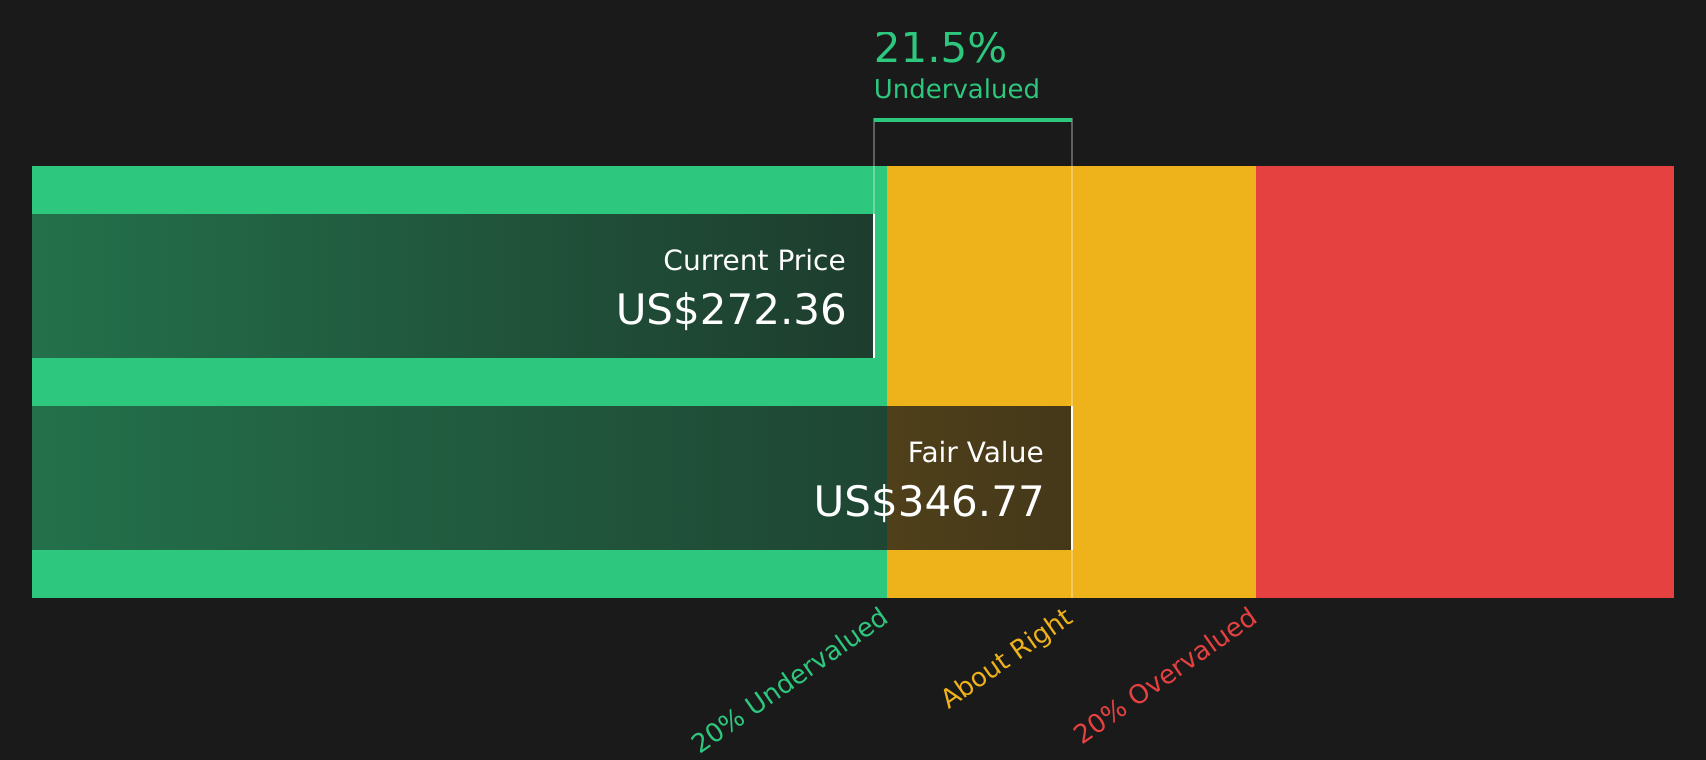
On this basis, the DCF model indicates an estimated intrinsic value of about $346.98 per share, compared with a current share price of around $277.49. That gap implies the stock trades at roughly a 20.0% discount to the model’s assessment of fair value.
Result: UNDERVALUED
Our Discounted Cash Flow (DCF) analysis suggests International Business Machines is undervalued by 20.0%. Track this in your watchlist or portfolio, or discover 46 more high quality undervalued stocks.
Approach 2: International Business Machines Price vs Earnings
For profitable companies, the P/E ratio is a useful shorthand for how much you are paying for each dollar of current earnings. It links directly to what many investors focus on most, the relationship between a stock’s price and the earnings that support it.
What counts as a “normal” or “fair” P/E ratio usually reflects two things: how fast earnings are expected to grow, and how risky those earnings are perceived to be. Higher growth or lower perceived risk can often justify a higher multiple, while lower growth or higher perceived risk can point to a lower one.
International Business Machines currently trades on a P/E of 24.30x. That sits above the IT industry average P/E of about 17.42x and above the peer group average of 12.67x. Simply Wall St’s Fair Ratio for the stock is 34.37x. This is a proprietary estimate of what the P/E might be, given factors such as earnings growth, industry, profit margin, market cap and identified risks.
Because the Fair Ratio incorporates these company specific drivers, rather than relying only on broad peer or industry comparisons, it offers a more tailored reference point. With a Fair Ratio of 34.37x versus the current P/E of 24.30x, the stock screens as undervalued on this metric.
Result: UNDERVALUED

P/E ratios tell one story, but what if the real opportunity lies elsewhere? Start investing in legacies, not executives. Discover our 20 top founder-led companies.
Upgrade Your Decision Making: Choose your International Business Machines Narrative
Earlier mention was made of an even better way to understand valuation, so here is Narratives, a simple tool on Simply Wall St’s Community page that lets you connect your view of International Business Machines to a set of numbers by telling a clear story about its revenue, earnings and margins. This links that story to a forecast and then to a fair value that you can compare with today’s price to guide buy or sell timing. Each Narrative updates as fresh news or earnings arrive. For example, one investor might build a bullish International Business Machines Narrative around a fair value of about US$335 per share based on revenue growth of 6.8%, a 17.1% profit margin and a future P/E of 29.6x. Another might build a more cautious one around a fair value of about US$195 per share using 3.9% revenue growth, a 13.4% margin and a future P/E of 23.6x. Seeing those stories side by side makes it easier for you to choose which assumptions you are most comfortable with.
For International Business Machines, here are previews of two leading International Business Machines Narratives to make comparison easier:
Fair value: about US$302.05 per share
Implied discount to this fair value: about 8.1% below the narrative fair value, based on the recent price of US$277.49
Revenue growth assumption: about 5.18% a year
- A focus on hybrid cloud, AI and acquisitions such as HashiCorp, with attention on how these areas shape revenue, margins and cash flow over time.
- Analysts building this view assume higher profit margins and earnings by 2028, supported by recurring software revenue and disciplined cost management.
- The narrative also flags clear risks, including macro conditions, software consumption trends, competition in areas like virtualization and the impact of currency moves.
Fair value: about US$256.08 per share
Implied premium to this fair value: about 8.4% above the narrative fair value, based on the recent price of US$277.49
Revenue growth assumption: about 6.0% a year
- This narrative focuses on IBM as a large enterprise technology stock that is already reflecting much of the hybrid cloud and AI story in its current valuation.
- It highlights execution risk in AI and quantum investments, the capital intensity of new projects and the possibility that monetization of these efforts takes time.
- It also points to competition from hyperscalers, headwinds in legacy areas and balance sheet considerations as factors that could cap valuation multiples.
If you want to go beyond these previews and see how your own assumptions compare with community views on IBM, you can review the full set of Narratives and stress test which story best matches your expectations before making any decisions.
Do you think there's more to the story for International Business Machines? Head over to our Community to see what others are saying!

This article by Simply Wall St is general in nature. We provide commentary based on historical data and analyst forecasts only using an unbiased methodology and our articles are not intended to be financial advice. It does not constitute a recommendation to buy or sell any stock, and does not take account of your objectives, or your financial situation. We aim to bring you long-term focused analysis driven by fundamental data. Note that our analysis may not factor in the latest price-sensitive company announcements or qualitative material. Simply Wall St has no position in any stocks mentioned.