

Is It Time To Reassess Intuitive Surgical (ISRG) After Its Recent Share Price Pullback
Intuitive Surgical, Inc. ISRG | 0.00 |
- If you are trying to figure out whether Intuitive Surgical stock is priced attractively or not, the recent share performance gives you a useful starting point but not the full story.
- The stock closed at US$418.55 most recently, with the share price down 6.8% over the last week, down 11.1% over the last month, down 25.5% year to date, and down 24.2% over the last year, while still showing a 36.0% gain over three years and 52.8% over five years.
- These mixed returns have kept attention on how much investors are willing to pay for Intuitive Surgical today compared with previous periods and with other opportunities in the market. Recent coverage has focused on how the share price pullback sits against the company’s longer term track record and its position in the medical equipment space. This helps frame whether this reset is a risk signal or an opportunity.
- Simply Wall St’s valuation model currently gives Intuitive Surgical a score of 1 out of 6. The next step is to look at how different methods like DCF and multiples arrive at that result and then finish with an approach that can help you put those numbers into a broader context.
Intuitive Surgical scores just 1/6 on our valuation checks. See what other red flags we found in the full valuation breakdown.
Approach 1: Intuitive Surgical Discounted Cash Flow (DCF) Analysis
A Discounted Cash Flow model takes the cash that a company is expected to generate in the future and discounts those amounts back to today, to estimate what the business could be worth right now.
For Intuitive Surgical, the latest twelve month Free Cash Flow is about $2.32b. Analysts and Simply Wall St projections point to Free Cash Flow of $4.27b in 2026, rising to a projected $6.14b by 2030. Beyond the analyst horizon, Simply Wall St extends those projections using its own growth assumptions. It then discounts each year’s cash flow using a 2 Stage Free Cash Flow to Equity approach.
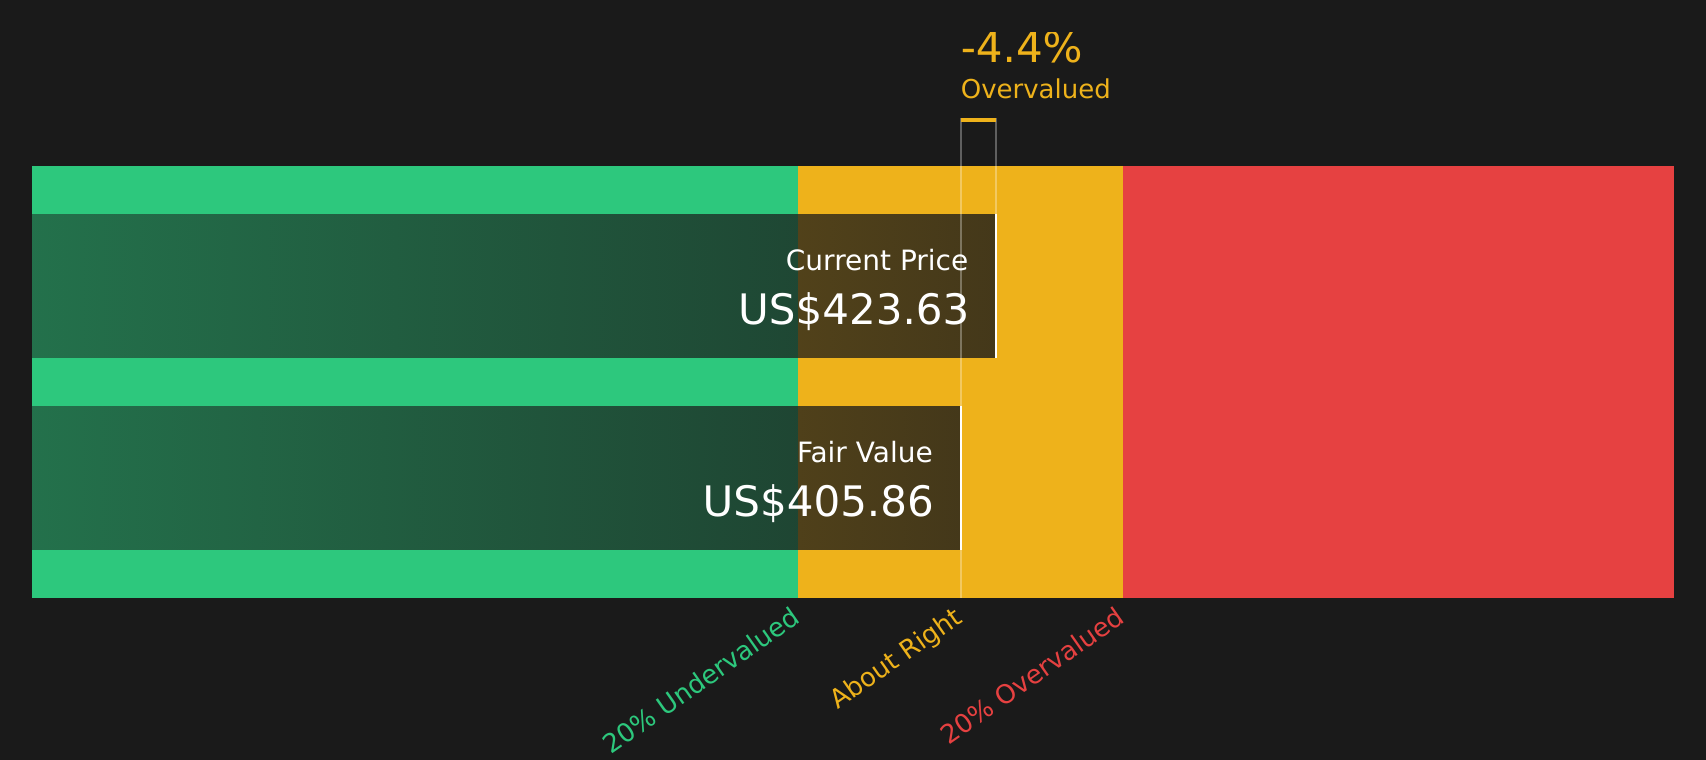
On this basis, the model arrives at an estimated intrinsic value of $405.16 per share. Compared with the recent share price of $418.55, the model suggests the stock is approximately 3.3% above its estimated fair value, which is a relatively small gap.
Result: ABOUT RIGHT
Intuitive Surgical is fairly valued according to our Discounted Cash Flow (DCF), but this can change at a moment's notice. Track the value in your watchlist or portfolio and be alerted on when to act.
Approach 2: Intuitive Surgical Price vs Earnings
For a profitable company like Intuitive Surgical, the P/E ratio is a useful way to think about valuation because it links what you pay per share to the earnings the business is currently generating.
In general, higher growth expectations and lower perceived risk can justify a higher P/E, while slower expected growth or higher risk tends to align with a lower, more conservative P/E. So a “normal” or “fair” P/E is not a fixed number; it depends on what the market expects from the company.
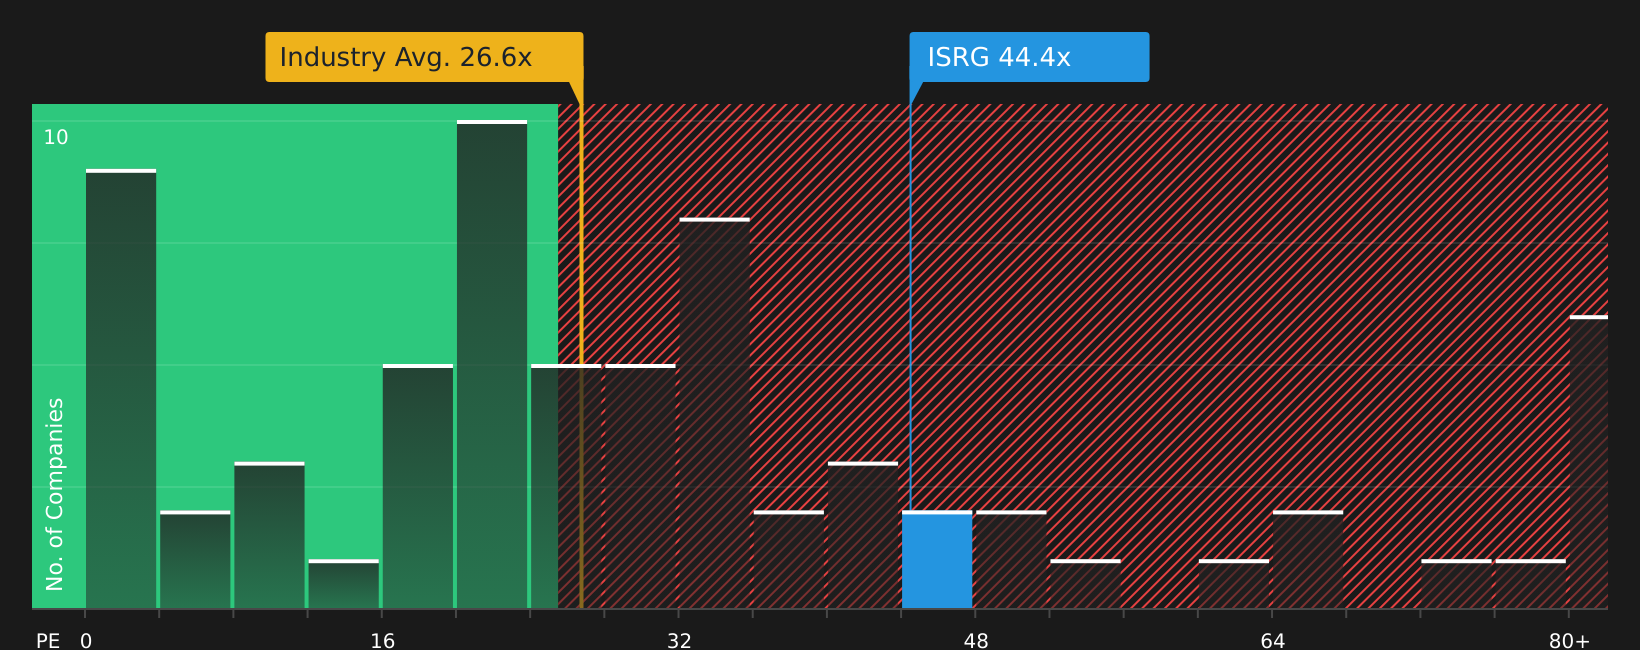
Intuitive Surgical currently trades on a P/E of 49.76x. That sits well above the Medical Equipment industry average P/E of 24.25x and the peer average of 25.30x. Simply Wall St’s Fair Ratio for Intuitive Surgical is 32.27x, which is its proprietary view of what the P/E could be given factors such as earnings growth, profit margins, industry, market cap and company specific risks. This Fair Ratio can be more useful than a simple peer or industry comparison because it adjusts for those differences rather than assuming every company deserves the same multiple.
Compared with the Fair Ratio of 32.27x, the current P/E of 49.76x points to the stock trading above that fair level.
Result: OVERVALUED
P/E ratios tell one story, but what if the real opportunity lies elsewhere? Start investing in legacies, not executives. Discover our 20 top founder-led companies.
Upgrade Your Decision Making: Choose your Intuitive Surgical Narrative
Earlier it was mentioned that there is an even better way to understand valuation. Narratives are introduced as a simple way for you to set out the story you believe about Intuitive Surgical, link it to concrete forecasts for revenue, earnings and margins, and then see the fair value that follows from that story.
On Simply Wall St’s Community page, Narratives turn this into an accessible tool by letting millions of investors share and compare their own fair values and assumptions. The platform then automatically lines those up against the live Intuitive Surgical share price so you can see whether a given story points to the stock appearing cheap or expensive.
Because Narratives are refreshed when new information such as earnings, recalls or product launches is added to the platform, your view is not static. You can watch how the gap between fair value and price changes as the facts change.
For Intuitive Surgical today, one Narrative on the cautious end assigns a fair value around US$325.55 while a more optimistic Narrative sits at US$750.00. This shows how different investors can look at the same company, plug in different growth, margin and P/E assumptions, and reach very different conclusions about what the stock may be worth.
For Intuitive Surgical however we will make it really easy for you with previews of two leading Intuitive Surgical Narratives:
Fair value: US$532.46 per share
Gap to current price: around 21.4% below this fair value estimate
Revenue growth assumption: 12%
- Describes Intuitive Surgical as a pioneer in robotic surgery with a wide moat built around its da Vinci systems and surgeon focused digital ecosystem.
- Highlights the importance of a large installed base and a high share of recurring revenue from instruments, services and software.
- Frames the stock as high quality but usually expensive, with fair value close to current levels based on assumptions for revenue growth, margins and a premium P/E.
Fair value: US$325.55 per share
Gap to current price: around 28.6% above this fair value estimate
Revenue growth assumption: 12%
- Focuses on strong demand drivers for robotic surgery but flags high upfront system costs, regulatory risk and reliance on the da Vinci platform.
- Assumes solid revenue growth and healthy margins but questions whether a high P/E can be sustained if growth or profitability soften.
- Concludes the stock looks expensive relative to that fair value estimate, with valuation sensitive to any slowdown, competitive pressure or policy changes.
Taken together, these Narratives show how the same revenue growth assumption can lead to very different views on fair value depending on the margin, P/E and risk profile you think are reasonable for Intuitive Surgical today. If you want to see more bullish, cautious or contrarian takes, and how their numbers translate into fair values, you can scan the wider set of Narratives that other investors have published for this stock, then decide which story fits closest with your own expectations for the business and the price you are prepared to pay.
To see how these results tie into long-term growth, risks, and valuation, check out the full range of community narratives for Intuitive Surgical on Simply Wall St. Add the company to your watchlist or portfolio so you'll be alerted when the story evolves.
Do you think there's more to the story for Intuitive Surgical? Head over to our Community to see what others are saying!

This article by Simply Wall St is general in nature. We provide commentary based on historical data and analyst forecasts only using an unbiased methodology and our articles are not intended to be financial advice. It does not constitute a recommendation to buy or sell any stock, and does not take account of your objectives, or your financial situation. We aim to bring you long-term focused analysis driven by fundamental data. Note that our analysis may not factor in the latest price-sensitive company announcements or qualitative material. Simply Wall St has no position in any stocks mentioned.