

Is It Time To Reassess Procter & Gamble (PG) After Its Recent Share Price Slide
Procter & Gamble Company PG | 0.00 |
- For readers wondering whether Procter & Gamble stock offers good value right now, especially after a choppy year, this article walks through the numbers so you can judge for yourself.
- The stock recently closed at US$144.44, with returns of 1.4% over the past week, a decline of 2.5% over the past month, a 1.9% gain year to date, and a decline of 10.4% over the last year. This raises questions about how the market currently views its risk and reward trade off.
- Recent coverage has focused on Procter & Gamble's position as a major household products company and how consumer staples stocks fit into broader portfolio allocations. This helps frame these recent price moves. For long term holders and new investors alike, this context matters when deciding whether to see recent weakness as a warning sign or a potential opening.
- Simply Wall St's valuation model gives Procter & Gamble a score of 4 out of 6. Next up is a closer look at how different valuation methods, and an even more comprehensive approach later in the article, line up with that score.
Approach 1: Procter & Gamble Discounted Cash Flow (DCF) Analysis
A Discounted Cash Flow model takes the cash that a company is expected to generate in the future, then discounts those projections back to today to estimate what the entire business could be worth now.
For Procter & Gamble, Simply Wall St uses a 2 Stage Free Cash Flow to Equity model. The latest twelve month Free Cash Flow stands at about $15.6b. Analyst based projections and later extrapolated estimates suggest Free Cash Flow of $14.8b in 2026, rising to a projected $21.1b in 2035, all in $ terms. Only the first few years are based on analyst estimates, with the later years extrapolated by Simply Wall St to extend the cash flow curve.
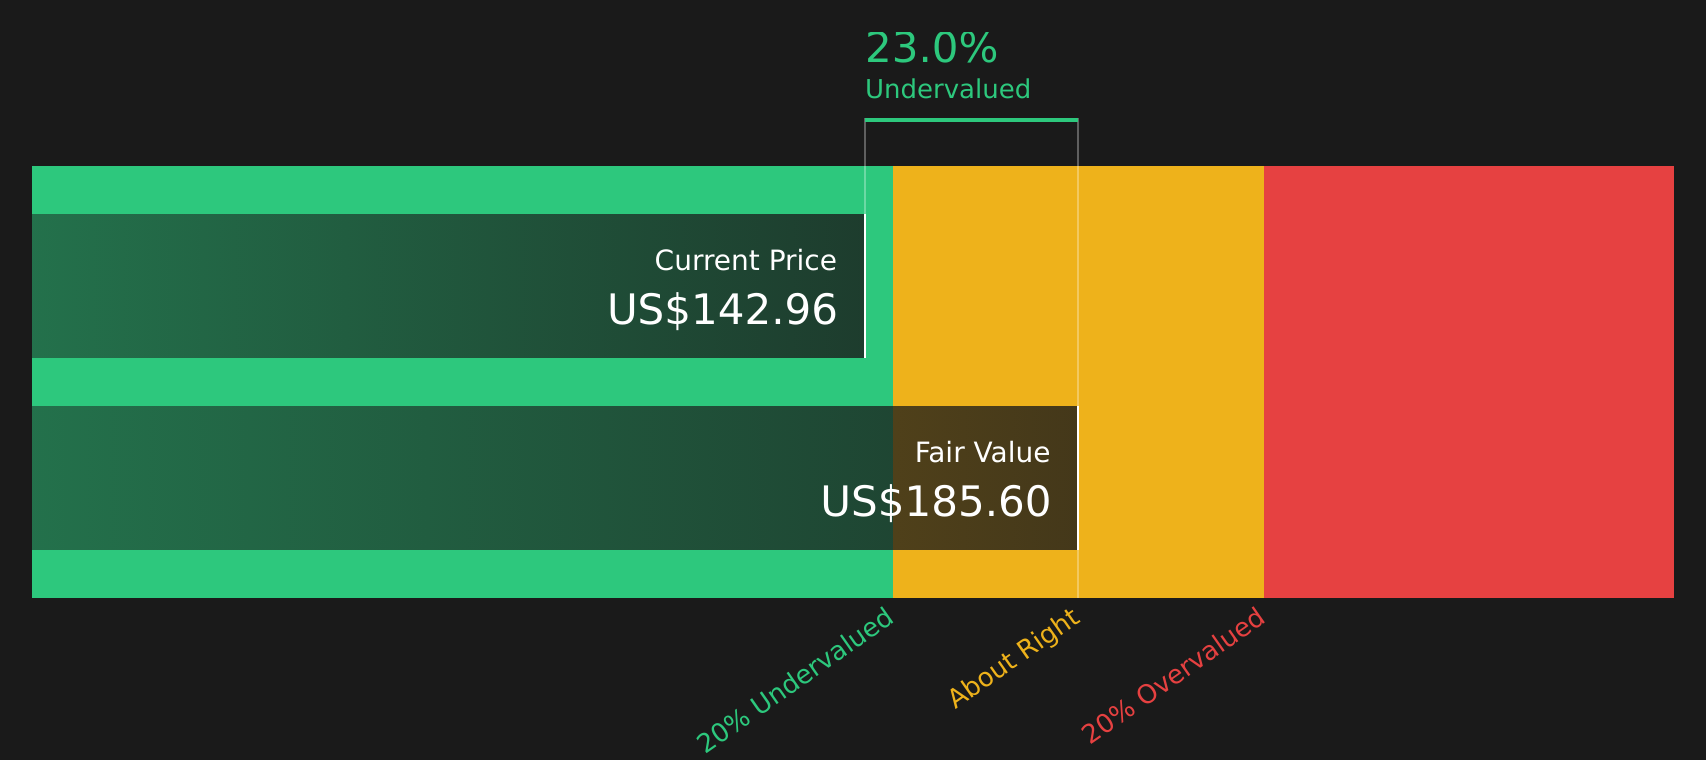
Discounting these projected cash flows back to today gives an estimated intrinsic value of $185.60 per share. Compared with the recent share price of $144.44, the model implies the stock trades at roughly a 22.2% discount, which in this model’s terms categorizes Procter & Gamble stock as undervalued on this specific cash flow view.
Result: UNDERVALUED
Our Discounted Cash Flow (DCF) analysis suggests Procter & Gamble is undervalued by 22.2%. Track this in your watchlist or portfolio, or discover 48 more high quality undervalued stocks.
Approach 2: Procter & Gamble Price vs Earnings
For a profitable company like Procter & Gamble, the P/E ratio is a useful way to relate what you pay for the stock to the earnings the business is currently generating. Investors typically weigh higher P/E ratios against expectations for future earnings growth and the level of risk, so what counts as a “normal” or “fair” P/E is usually higher for companies with stronger growth outlooks or lower perceived risk.
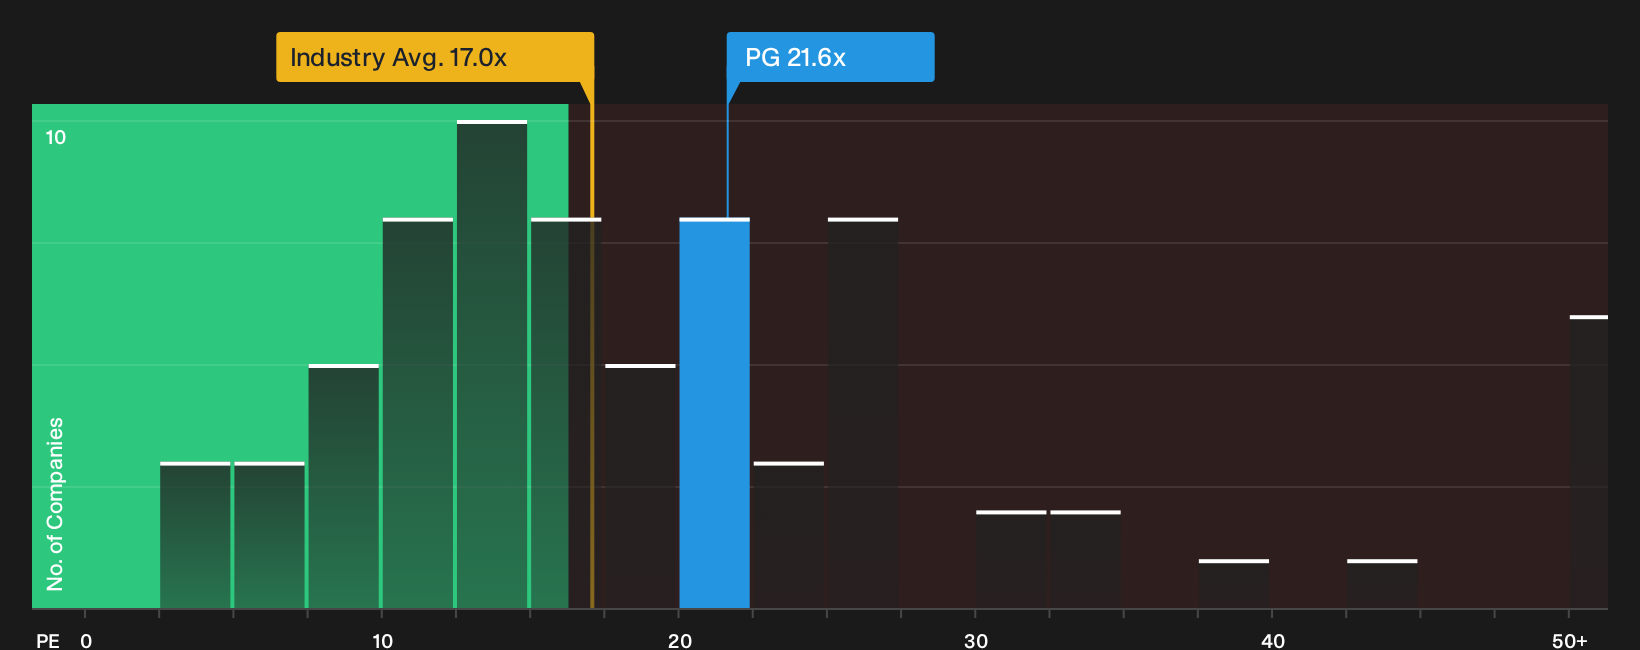
Procter & Gamble currently trades on a P/E of 20.61x. That sits above the Household Products industry average of 16.59x, but below the peer group average of 25.04x. Simply Wall St also calculates a “Fair Ratio” of 24.18x, which is the P/E level suggested by factors such as earnings growth characteristics, industry, profit margins, market cap and company specific risks.
This Fair Ratio is more tailored than a simple comparison with peers or an industry average because it adjusts for Procter & Gamble’s own profile rather than assuming that all companies should trade on similar multiples. Set against the current P/E of 20.61x, the Fair Ratio of 24.18x indicates that the stock trades below this model based estimate of fair value.
Result: UNDERVALUED
P/E ratios tell one story, but what if the real opportunity lies elsewhere? Start investing in legacies, not executives. Discover our 20 top founder-led companies.
Upgrade Your Decision Making: Choose your Procter & Gamble Narrative
Earlier it was mentioned that there is an even better way to understand valuation, so on Simply Wall St you can use Narratives, where you describe your story for Procter & Gamble, link it to specific assumptions for future revenue, earnings and margins, and end up with your own fair value that is then compared with the current price to help you judge whether the stock looks attractive or stretched.
For Procter & Gamble, however, we will make it really easy for you with previews of two leading Procter & Gamble Narratives:
Narrative fair value: US$150.00 per share
Implied discount to this narrative fair value: about 3.7% below the narrative fair value based on the recent price of US$144.44
Narrative revenue growth assumption: 8.09%
- The author sees the recent share price weakness, from around US$175 to roughly US$140 over the referenced period, as potentially pushing the stock into oversold territory relative to their own fair value estimate.
- They highlight Procter & Gamble's broad portfolio of established consumer brands, high gross and net margins, and global footprint as key supports for earnings resilience.
- At the same time, they flag heavier recent insider selling and elevated leverage as factors to watch, suggesting the stock sits on a watchlist pending clearer signals from price action and insider activity.
Narrative fair value: US$121.06 per share
Implied premium to this narrative fair value: about 19.3% above the narrative fair value based on the recent price of US$144.44
Narrative revenue growth assumption: 3.32%
- This author values Procter & Gamble using a blend of methods, including DDM, DCF and several historical multiples, and arrives at a weighted fair value that is below the recent share price.
- The narrative points to strong profitability metrics, a wide moat rating, and an Aa3 credit rating as signs of a solid business, but pairs this with relatively modest projected revenue and EPS growth.
- Across the valuation work and Monte Carlo simulations, the conclusion is that at the referenced price levels the stock screens as expensive relative to the author's assumptions and required return.
If you want to see more than just these previews and understand how different investors are weighing growth, quality and price for this stock, it is worth spending a few minutes with the full set of narratives and supporting data.To see how these results tie into long-term growth, risks, and valuation, check out the full range of community narratives for Procter & Gamble on Simply Wall St. Add the company to your watchlist or portfolio so you'll be alerted when the story evolves.
Do you think there's more to the story for Procter & Gamble? Head over to our Community to see what others are saying!

This article by Simply Wall St is general in nature. We provide commentary based on historical data and analyst forecasts only using an unbiased methodology and our articles are not intended to be financial advice. It does not constitute a recommendation to buy or sell any stock, and does not take account of your objectives, or your financial situation. We aim to bring you long-term focused analysis driven by fundamental data. Note that our analysis may not factor in the latest price-sensitive company announcements or qualitative material. Simply Wall St has no position in any stocks mentioned.