Is It Time To Reassess Zscaler (ZS) After The Recent Share Price Slump
Zscaler, Inc. ZS | 0.00 |
- If you are wondering whether Zscaler is starting to look attractively priced or still expensive, this article will walk through what the current share price might be implying about its value.
- The stock last closed at US$167.33, with returns of 16.3% decline over 7 days, 22.8% decline over 30 days, 24.1% decline year to date and 18.6% decline over 1 year, set against a 25.0% gain over 3 years and 26.1% decline over 5 years.
- Recent news coverage has focused on Zscaler as a key name in cloud security, with attention on how enterprises are adopting zero trust architectures and consolidating security vendors. Investors have also been watching commentary around cybersecurity spending and digital transformation priorities, which helps frame how they view the recent share price moves.
- On our checklist based valuation, Zscaler scores 4 out of 6 for its value score, which you can review in detail at 4 out of 6. Next we will look at how different valuation approaches assess the stock, and later we will come back to an even more holistic way to think about its valuation story.
Approach 1: Zscaler Discounted Cash Flow (DCF) Analysis
A Discounted Cash Flow, or DCF, model estimates what a company could be worth by projecting its future cash flows and then discounting those back to today’s value. In this case, the model used is a 2 Stage Free Cash Flow to Equity approach based on cash flow projections.
Zscaler’s latest twelve month free cash flow is about $854.4 million. Analyst inputs and further extrapolations point to projected free cash flow of $2.27b by 2030, with a series of annual estimates and extensions in between that are all discounted back using Simply Wall St’s assumptions.
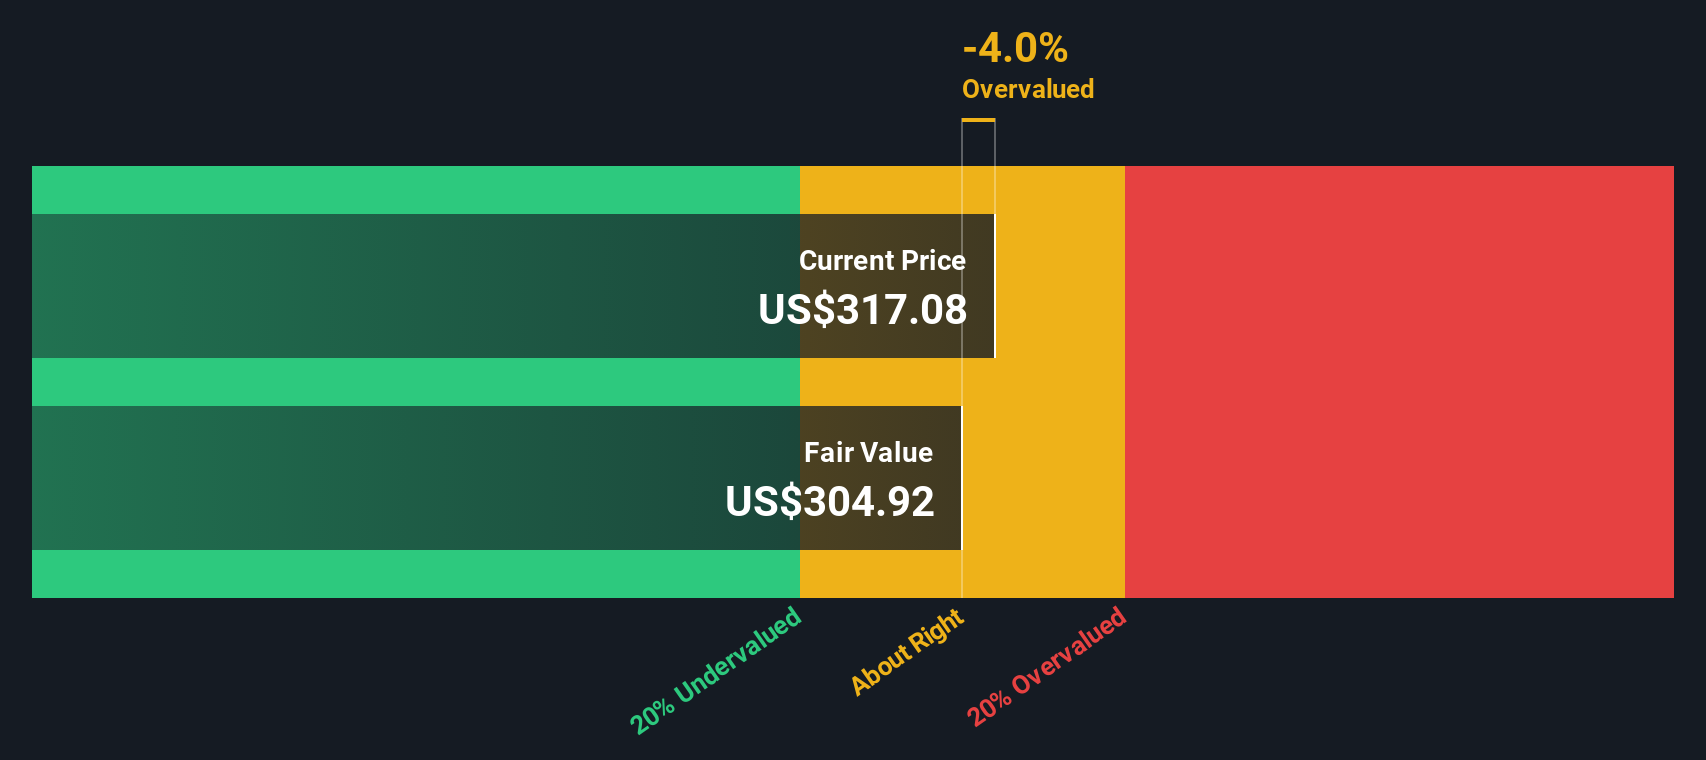
Pulling those discounted cash flows together, the model arrives at an estimated intrinsic value of about $296.88 per share. Compared with the recent share price of $167.33, this implies the stock is trading at a 43.6% discount to that DCF estimate. According to this model, the shares screen as undervalued on this basis alone.
Result: UNDERVALUED
Our Discounted Cash Flow (DCF) analysis suggests Zscaler is undervalued by 43.6%. Track this in your watchlist or portfolio, or discover 52 more high quality undervalued stocks.
Approach 2: Zscaler Price vs Sales
For a business like Zscaler, where investors often focus on revenue rather than net profit, the P/S ratio is a useful way to think about what you are paying for each dollar of sales. Higher expected growth and lower perceived risk usually justify a higher P/S ratio, while slower expected growth or higher risk tend to support a lower, more conservative multiple.
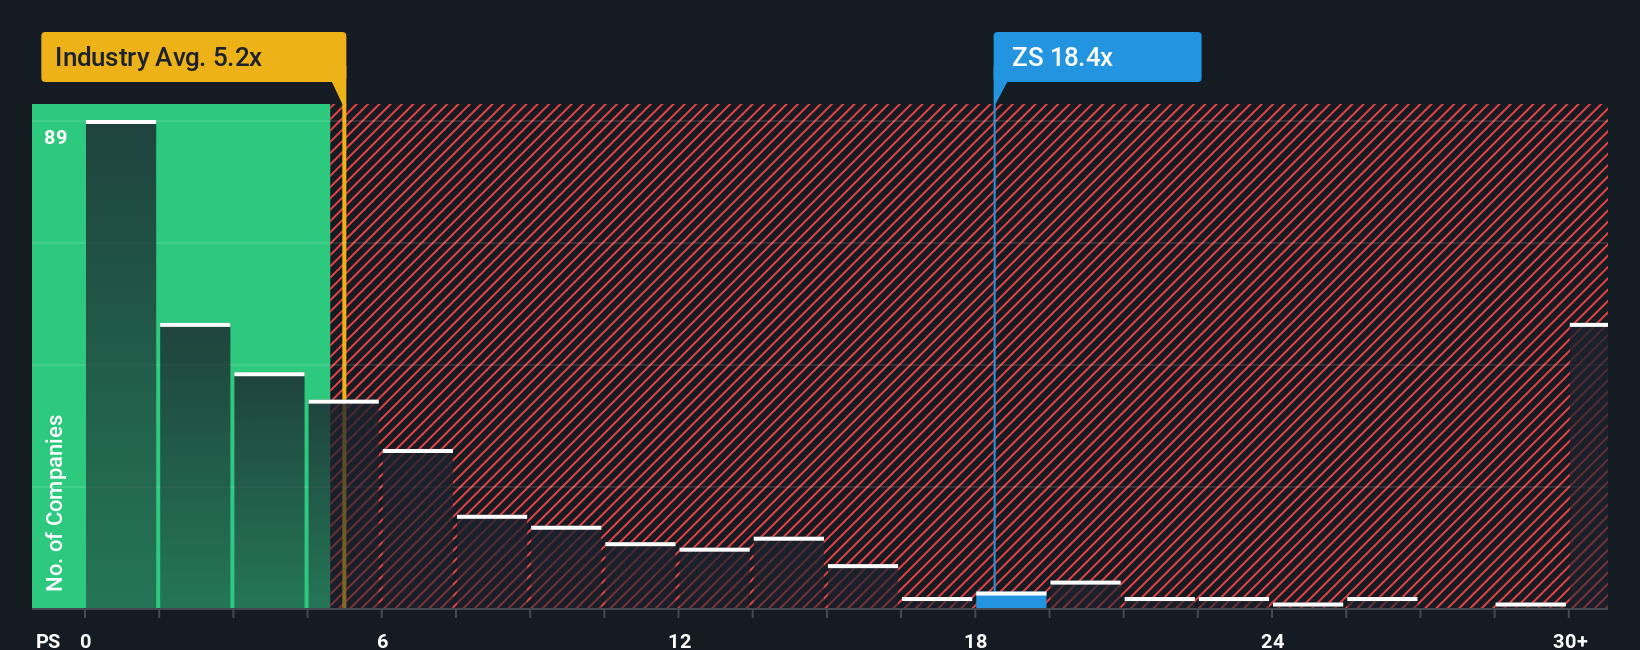
Zscaler currently trades on a P/S of 9.42x. That sits above the broader Software industry average of 3.84x and is slightly below the peer group average of 9.84x. Simply Wall St also calculates a “Fair Ratio” of 9.03x for Zscaler. This is a proprietary estimate of what the P/S might be, given factors such as its earnings growth profile, industry, profit margins, market cap and specific risks.
The Fair Ratio is more tailored than a simple comparison with peers or the industry, because it tries to reflect Zscaler’s own fundamentals and risk characteristics rather than assuming one size fits all. Compared with the current P/S of 9.42x, the Fair Ratio of 9.03x suggests the shares are slightly expensive on this measure, so they screen as overvalued on the preferred multiple approach.
Result: OVERVALUED
P/S ratios tell one story, but what if the real opportunity lies elsewhere? Start investing in legacies, not executives. Discover our 22 top founder-led companies.
Upgrade Your Decision Making: Choose your Zscaler Narrative
Earlier we mentioned that there is an even better way to think about valuation. On Simply Wall St’s Community page, you can use Narratives to set out your own story for Zscaler, link that story to explicit forecasts for revenue, earnings and margins, and arrive at a Fair Value you can compare with today’s price. The platform then updates your view as new news or earnings arrive. For example, one Zscaler Narrative currently anchors around a Fair Value of about US$172.68, while another sits closer to US$389.18. This shows how two investors, looking at the same business, can reasonably reach very different conclusions about when the shares might look attractive or stretched.
Do you think there's more to the story for Zscaler? Head over to our Community to see what others are saying!
This article by Simply Wall St is general in nature. We provide commentary based on historical data and analyst forecasts only using an unbiased methodology and our articles are not intended to be financial advice. It does not constitute a recommendation to buy or sell any stock, and does not take account of your objectives, or your financial situation. We aim to bring you long-term focused analysis driven by fundamental data. Note that our analysis may not factor in the latest price-sensitive company announcements or qualitative material. Simply Wall St has no position in any stocks mentioned.