Is It Time To Reconsider Amazon.com (AMZN) After The Recent Share Price Pullback?
Amazon.com, Inc. AMZN | 0.00 |
- If you are wondering whether Amazon.com at around US$250.02 is still offering value after years of strong share price moves, this breakdown is designed to help you frame that question clearly.
- Even with the stock down about 8.0% over the last week and 8.1% over the last month, it remains up 10.4% year to date and 20.6% over the past year, which can change how you think about both upside potential and downside risk.
- Recent headlines have continued to focus on Amazon.com's role in ecommerce, cloud computing and broader technology themes, which keeps the stock firmly in the spotlight for investors watching long term secular trends. At the same time, discussions around competition, regulation and shifting consumer behavior provide important context for the recent pullback and longer term gains.
- Right now Amazon.com carries a valuation score of 4 out of 6. The next sections will walk through traditional methods like P/E, cash flow and asset based valuation, and then finish with a framework that helps you interpret all of those signals together.
Approach 1: Amazon.com Discounted Cash Flow (DCF) Analysis
A Discounted Cash Flow, or DCF, model estimates what a stock could be worth by projecting the cash the company may generate in the future and discounting those amounts back to today.
For Amazon.com, the model used here is a 2 Stage Free Cash Flow to Equity approach. The latest twelve month Free Cash Flow is about $37.1b. Analysts and model projections point to Free Cash Flow of $182.4b by 2030, with a path that includes both analyst estimates for the next few years and then extrapolated figures provided by Simply Wall St for later years.
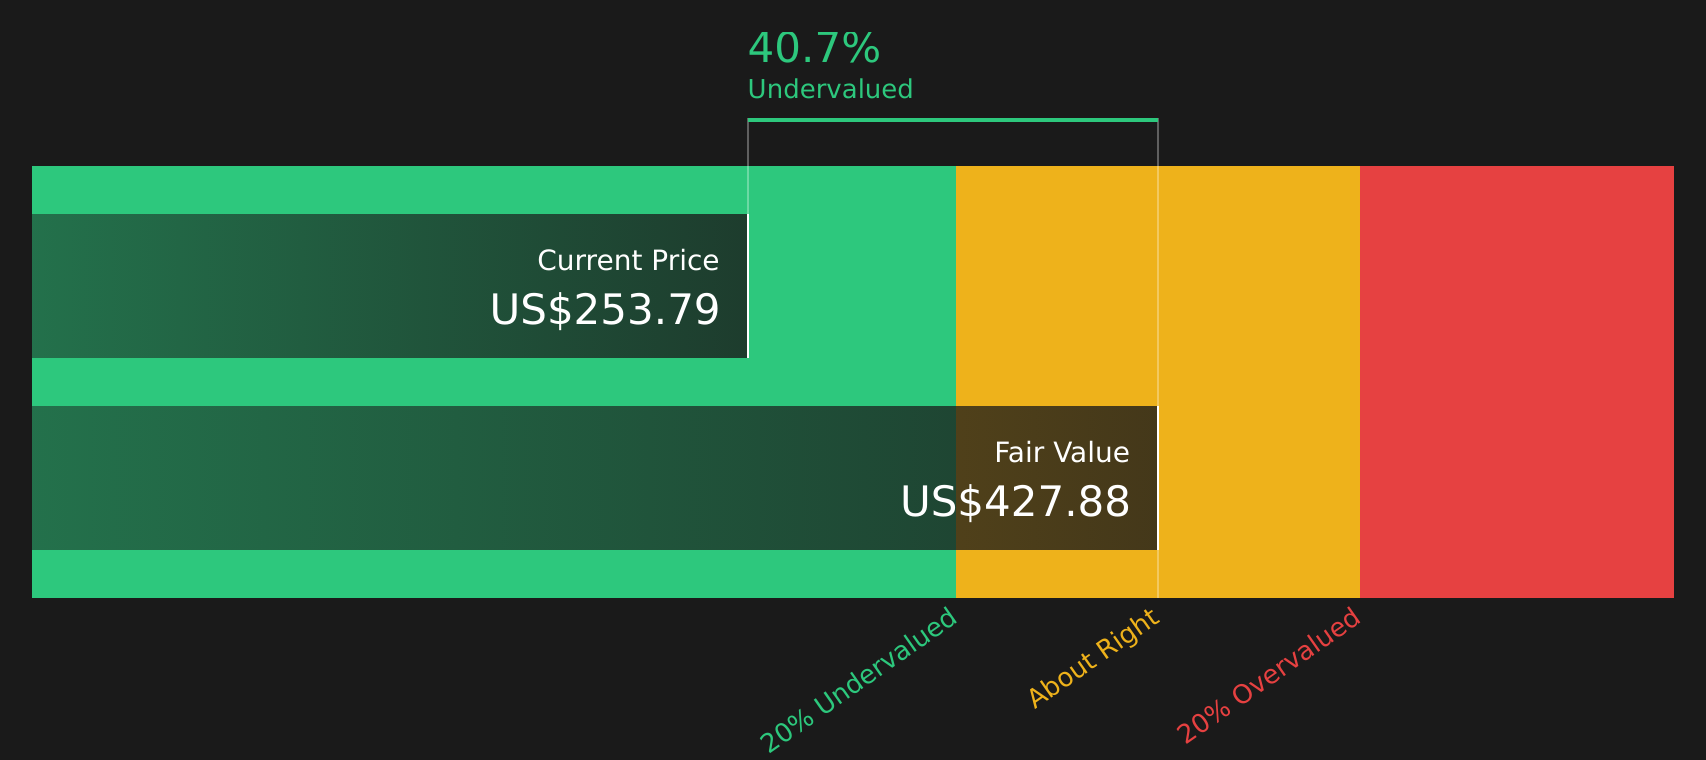
When all these projected cash flows are discounted back to today, the resulting estimated intrinsic value comes out at about $420.82 per share. Against the current share price of around $250.02, this implies the stock is trading at a discount of roughly 40.6%, which the model interprets as undervalued.
Result: UNDERVALUED
Our Discounted Cash Flow (DCF) analysis suggests Amazon.com is undervalued by 40.6%. Track this in your watchlist or portfolio, or discover 47 more high quality undervalued stocks.
Approach 2: Amazon.com Price vs Earnings
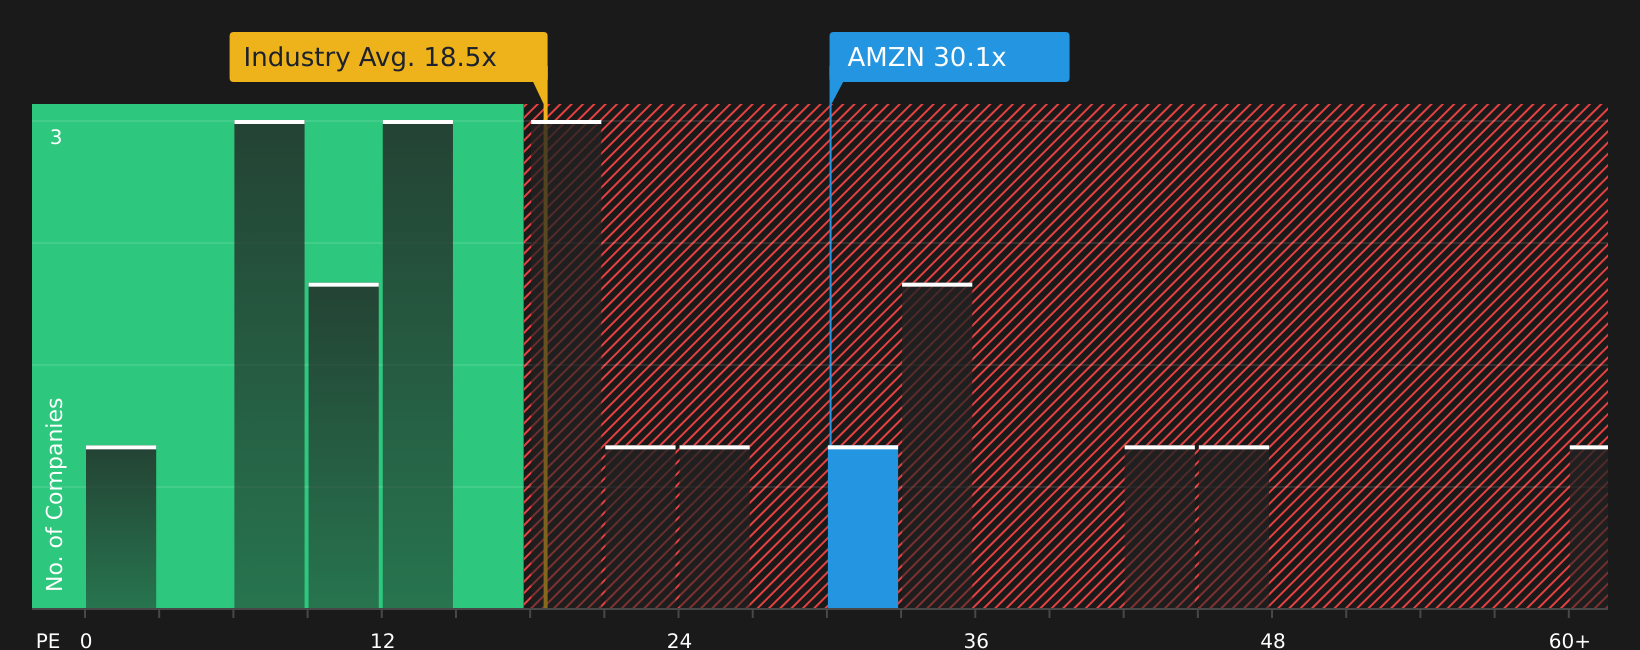
For profitable companies, the P/E ratio is a useful shorthand because it connects what you pay for the stock today with the earnings it is currently generating. It lets you compare how much the market is paying for each dollar of earnings across different companies and sectors.
What counts as a “normal” P/E often reflects expectations for future growth and the risk investors see in those earnings. Higher expected growth or lower perceived risk can support a higher P/E, while slower growth or higher risk usually calls for a lower P/E.
Amazon.com currently trades on a P/E of 29.62x. That sits above both the Multiline Retail industry average of 18.79x and a peer average of 23.63x, which might initially look expensive if you only compare simple multiples. Simply Wall St’s Fair Ratio aims to refine this by estimating what P/E could be reasonable given factors like earnings growth, profit margins, industry, market cap and specific risks.
Because the Fair Ratio for Amazon.com is 45.32x, and the stock trades on a P/E meaningfully below that level, this framework suggests the shares may be undervalued on an earnings multiple basis.
Result: UNDERVALUED
Wall Street's queuing for one rocket. While SpaceX counts down to its IPO, other companies tied to the new space race are already in orbit. → 20 Compelling Space Companies watchlist · Global Space Race Investing Ideas screener · Scan the sector by valuation on Rocket Lab's valuation page.
Upgrade Your Decision Making: Choose your Amazon.com Narrative
Earlier it was mentioned that there is an even better way to understand valuation. This is where Narratives come in as a simple way for you to attach a clear story to your numbers for Amazon.com, including your view of fair value and expectations for future revenue, earnings and margins.
A Narrative on Simply Wall St links three pieces together: your view of the company’s story, a financial forecast that reflects that story and a resulting fair value that you can then compare to the current share price to decide whether the stock looks expensive or cheap on your terms.
These Narratives sit inside the Community page on Simply Wall St, are used by millions of investors, and update automatically when new information such as earnings or major news arrives. This helps your story and valuation stay aligned with the latest data without extra work from you.
For Amazon.com, one investor might focus on the higher margin side of the business and arrive at a fair value of about US$475.09 per share. Another might build in more conservative assumptions around margins and growth and land closer to US$215.55. Putting these side by side helps you see which story and valuation logic you find more reasonable before acting.
For Amazon.com however, we will make it really easy for you with previews of two leading Amazon.com Narratives:
Start with a bullish take that leans into AI, advertising and margin expansion. Then compare it with a more cautious view that focuses on execution risks and what investors are willing to pay today for future growth.
Fair value in this Narrative: US$450.00 per share
Implied discount to this fair value at US$250.02: about 44.4% undervalued
Revenue growth assumption in this Narrative: 8.95%
- The author argues that current margin pressure reflects heavy AI, cloud and logistics investment that is intended to lift earnings power over time rather than a weak core business.
- AWS, advertising and a more efficient retail operation are presented as the main engines that could support a higher earnings base as utilization improves.
- The thesis is that the stock price does not fully reflect these potential earnings, so the gap between current price and the US$450 fair value is seen as an opportunity in this view.
Fair value in this Narrative: US$234.75 per share
Implied premium to this fair value at US$250.02: about 6.5% overvalued
Revenue growth assumption in this Narrative: 13.6%
- This author highlights Amazon's scale in ecommerce, AWS and advertising, but balances that against factors such as competitive pressure in cloud and constraints around chips, power and tariffs.
- The Narrative walks through recent quarterly results, new customer wins and product launches, then uses those data points to build return projections over 2, 5 and 10 years.
- On those assumptions, a fair value of US$234.75 is used as an anchor, which leaves the current price slightly above the author's preferred entry level despite a constructive view on the business long term.
If you want to go beyond these previews and see how your own expectations line up against other investors, you can read the full Narratives, compare the underlying assumptions and then decide which story fits your view of Amazon.com best.
To see how these results tie into long-term growth, risks, and valuation, check out the full range of community narratives for Amazon.com on Simply Wall St. Add the company to your watchlist or portfolio so you'll be alerted when the story evolves.
Do you think there's more to the story for Amazon.com? Head over to our Community to see what others are saying!

This article by Simply Wall St is general in nature. We provide commentary based on historical data and analyst forecasts only using an unbiased methodology and our articles are not intended to be financial advice. It does not constitute a recommendation to buy or sell any stock, and does not take account of your objectives, or your financial situation. We aim to bring you long-term focused analysis driven by fundamental data. Note that our analysis may not factor in the latest price-sensitive company announcements or qualitative material. Simply Wall St has no position in any stocks mentioned.