Is It Time To Reconsider BioMarin Pharmaceutical (BMRN) After Multi Year Share Price Weakness
BioMarin Pharmaceutical Inc. BMRN | 0.00 |
- Investors may be wondering whether BioMarin Pharmaceutical's share price lines up with its underlying value, especially after a mixed run for the stock.
- At a last close of US$54.62, the stock has recorded a 1.5% decline over 7 days, is up 0.9% over 30 days, but is still showing returns of an 8.1% decline year to date and an 11.2% decline over 1 year.
- These moves sit against a longer backdrop of weaker returns, with 3-year returns at a 42.8% decline and 5-year returns at a 31.5% decline. For investors who focus on entry price, this track record raises fair questions about whether the current level already reflects past disappointments or leaves room for upside.
- BioMarin currently holds a valuation score of 2 out of 6. The next step is to walk through how different valuation methods judge the stock today and then look at a more complete way of thinking about value that ties those methods together.
BioMarin Pharmaceutical scores just 2/6 on our valuation checks. See what other red flags we found in the full valuation breakdown.
Approach 1: BioMarin Pharmaceutical Discounted Cash Flow (DCF) Analysis
A Discounted Cash Flow, or DCF, model takes estimates of a company’s future cash flows and discounts them back to today’s value to arrive at an implied intrinsic share price.
For BioMarin Pharmaceutical, the latest twelve month Free Cash Flow is about $711.9 million. The DCF model used here is a 2 Stage Free Cash Flow to Equity approach, which blends analyst inputs and longer term extrapolations. Analyst projections and extensions suggest Free Cash Flow could reach about $1.6 billion by 2035, with interim points such as $860 million in 2026 and $1,079 million in 2027. Simply Wall St provides analyst inputs for the nearer years and then extrapolates beyond that.
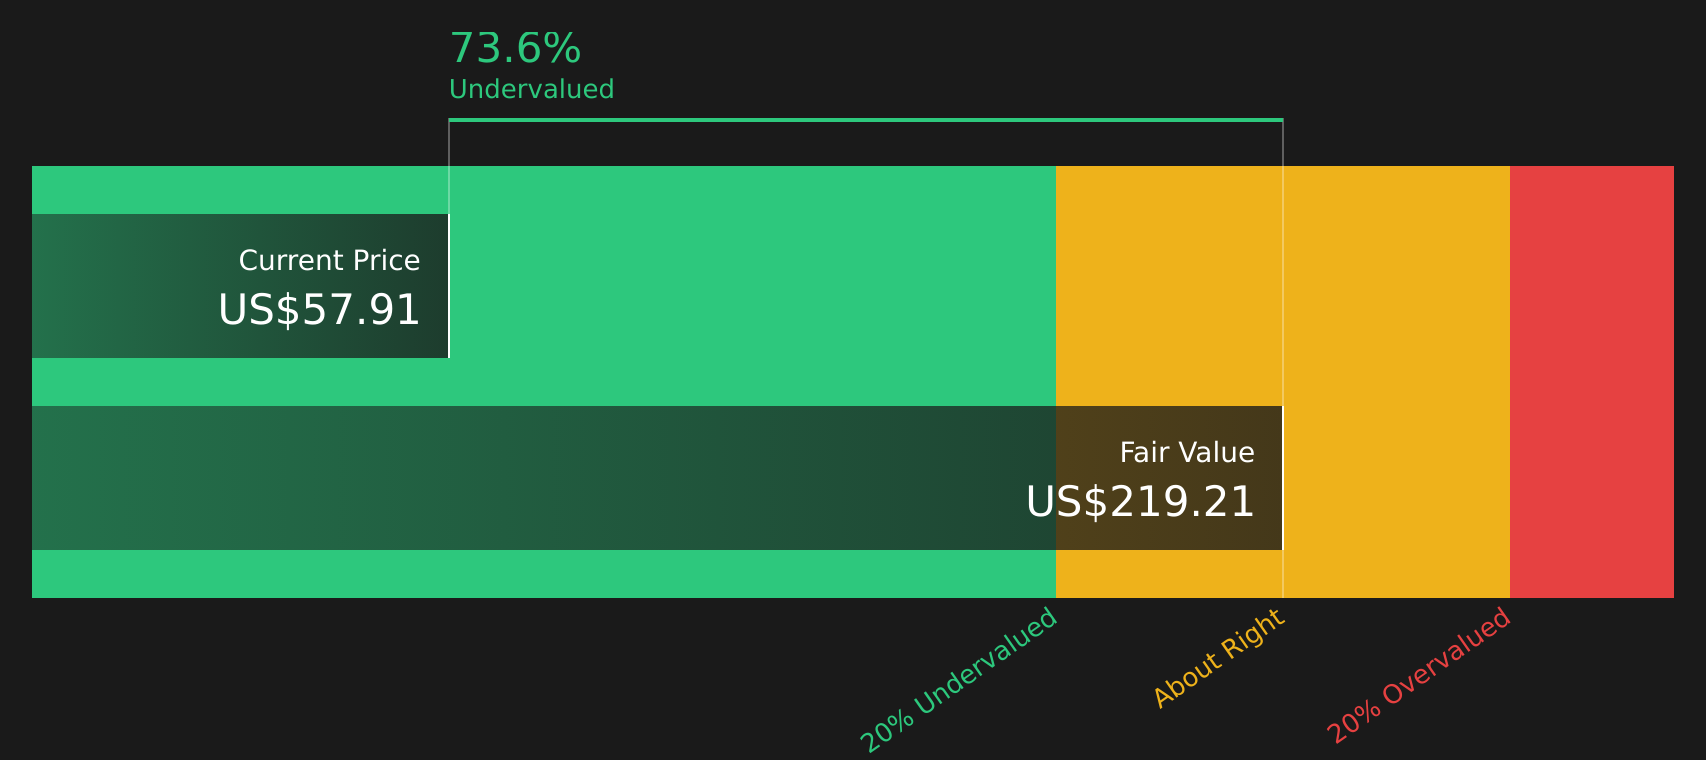
On this basis, the model estimates an intrinsic value of about $190.15 per share. Compared with the recent share price of $54.62, this implies the stock is about 71.3% undervalued according to this DCF framework.
Result: UNDERVALUED
Our Discounted Cash Flow (DCF) analysis suggests BioMarin Pharmaceutical is undervalued by 71.3%. Track this in your watchlist or portfolio, or discover 58 more high quality undervalued stocks.
Approach 2: BioMarin Pharmaceutical Price vs Earnings (P/E)
For profitable companies, the P/E ratio is a straightforward way to compare what you pay for each dollar of earnings with other stocks and with the broader market. It connects directly to what many investors watch most closely, the relationship between earnings power and share price.
What counts as a “normal” P/E depends on how quickly earnings are expected to grow and how risky those earnings appear. Higher expected growth or lower perceived risk can justify a higher P/E, while weaker growth or higher uncertainty usually points to a lower multiple.
BioMarin currently trades on a P/E of 30.11x. This sits above the Biotechs industry average of 17.02x and also above the peer group average of 20.68x. Simply Wall St’s Fair Ratio for BioMarin is 24.23x, which reflects a tailored view of what P/E might make sense given factors such as earnings growth, profit margins, market cap, risk profile and the Biotechs sector context.
Because the Fair Ratio blends these company specific inputs, it can provide a more rounded yardstick than simple peer or industry comparisons. With the current P/E of 30.11x sitting higher than the 24.23x Fair Ratio, the shares screen as expensive on this metric.
Result: OVERVALUED

P/E ratios tell one story, but what if the real opportunity lies elsewhere? Start investing in legacies, not executives. Discover our 19 top founder-led companies.
Upgrade Your Decision Making: Choose your BioMarin Pharmaceutical Narrative
Earlier it was mentioned that there is an even better way to understand valuation. This is where Narratives come in, giving you a simple way to write the story you believe about BioMarin Pharmaceutical and link that story to your own forecast for revenue, earnings, margins and a fair value, all within the Simply Wall St Community page that millions of investors use.
A Narrative is your structured view of the business that connects what you think will happen, such as how concentrated product risk, drug pricing pressure or rare disease demand might play out, to specific numbers and an implied fair value that you can then compare with today’s share price to decide whether the stock looks attractive, fully priced or expensive for you personally.
Because Narratives on Simply Wall St are live tools that update when new news, earnings or guidance arrive, you are not locked into a static model and can see how your fair value changes as fresh information comes through. This is instead of relying only on point in time P/E or DCF snapshots.
For BioMarin Pharmaceutical, for example, one Narrative might lean toward the lower analyst fair value around US$55.66 and focus on pricing, competition and product concentration risk. Another might align with a higher view near US$120 and emphasize rare disease demand, pipeline potential and the impact of acquisitions, showing how rational investors can reach very different conclusions from the same starting data.
Do you think there's more to the story for BioMarin Pharmaceutical? Head over to our Community to see what others are saying!

This article by Simply Wall St is general in nature. We provide commentary based on historical data and analyst forecasts only using an unbiased methodology and our articles are not intended to be financial advice. It does not constitute a recommendation to buy or sell any stock, and does not take account of your objectives, or your financial situation. We aim to bring you long-term focused analysis driven by fundamental data. Note that our analysis may not factor in the latest price-sensitive company announcements or qualitative material. Simply Wall St has no position in any stocks mentioned.