Is It Too Late To Consider AbbVie (ABBV) After Its Strong Multi‑Year Share Price Run?
AbbVie, Inc. ABBV | 0.00 |
- If you are wondering whether AbbVie is still reasonably priced after its strong run, this article walks through what the current share price could be implying about value.
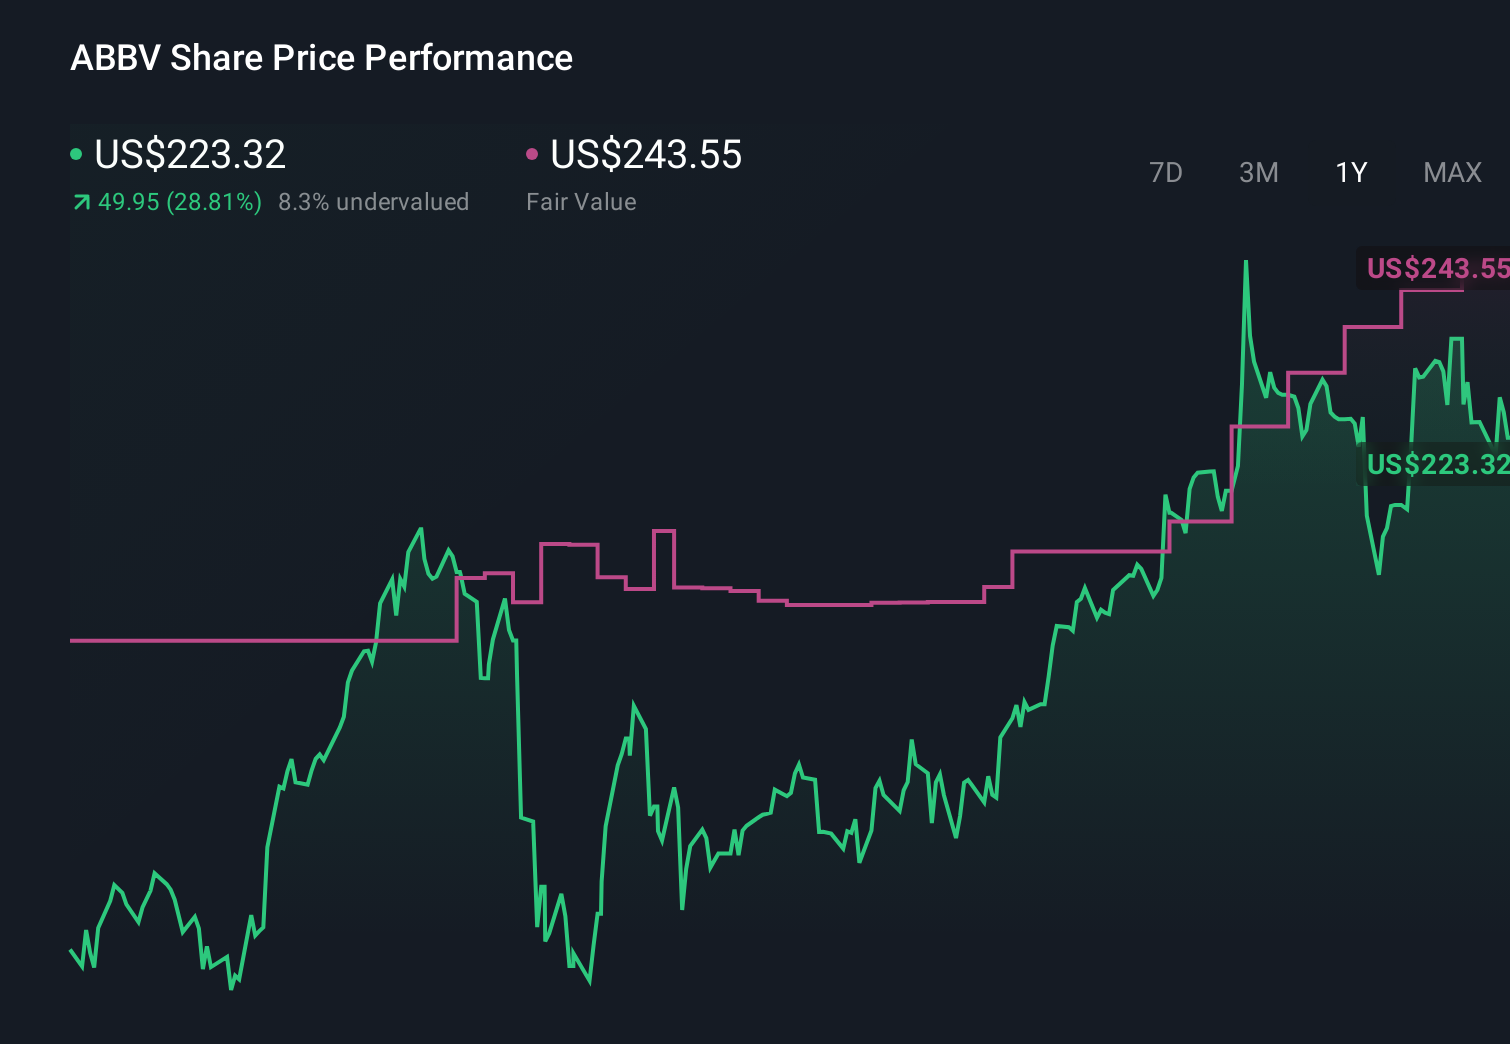
- With AbbVie closing at US$231.50 and showing returns of 3.6% over 7 days, 4.3% over 30 days and 24.1% over 1 year, many investors are asking whether the recent share price performance already reflects its prospects or if there is still room based on fundamentals.
- Recent attention on AbbVie has focused on its position in large cap pharmaceuticals and how investors are weighing its product portfolio and pipeline against competitive and patent related considerations. These themes help frame why the stock has attracted interest over periods such as the last 3 and 5 years, where returns of 70.5% and 166.9% respectively are part of the discussion around risk and reward.
- Right now AbbVie scores 2 out of 6 on our valuation checks, as shown in our valuation score. We will look at what different valuation approaches say about the stock and then finish with a way to think about valuation that can give you a clearer overall picture.
AbbVie scores just 2/6 on our valuation checks. See what other red flags we found in the full valuation breakdown.
Approach 1: AbbVie Discounted Cash Flow (DCF) Analysis
A DCF model takes estimates of a company’s future cash flows, then discounts them back to today’s dollars to arrive at an estimate of what the whole business might be worth right now.
For AbbVie, the model used is a 2 Stage Free Cash Flow to Equity approach based on cash flow projections. The latest twelve month free cash flow is about US$19.9b. Analyst inputs and extrapolated estimates suggest free cash flow of roughly US$24.6b in 2026. It then increases through the forecast period to about US$34.5b in 2035, with values beyond the first five years extrapolated by Simply Wall St from earlier projections.
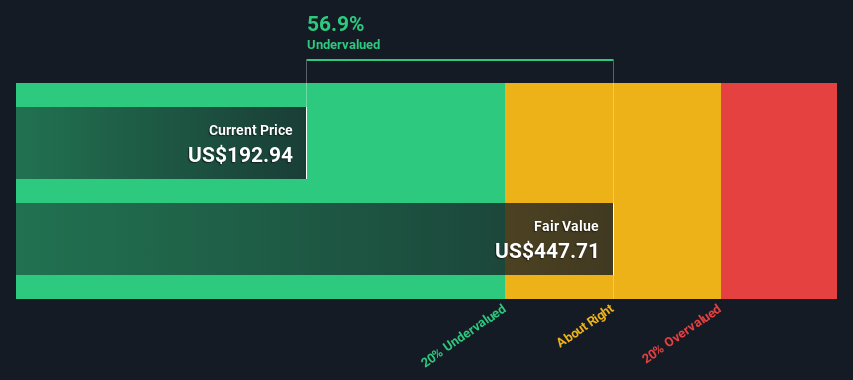
Discounting those projected cash flows back to today gives an estimated intrinsic value of US$372.03 per share. Compared with the recent share price of US$231.50, the DCF output implies AbbVie trades at about a 37.8% discount. This indicates that the shares are undervalued on this model.
Result: UNDERVALUED
Our Discounted Cash Flow (DCF) analysis suggests AbbVie is undervalued by 37.8%. Track this in your watchlist or portfolio, or discover 53 more high quality undervalued stocks.
Approach 2: AbbVie Price vs Earnings
For profitable companies, the P/E ratio is a useful shorthand because it links what you pay for each share to the earnings that the business is currently generating. It gives you a quick sense of how many dollars investors are paying for each dollar of earnings.
What counts as a “normal” P/E will usually reflect how the market views a company’s growth outlook and risk profile. Higher expected growth or lower perceived risk can justify a higher multiple, while slower growth or higher risk can keep it lower.
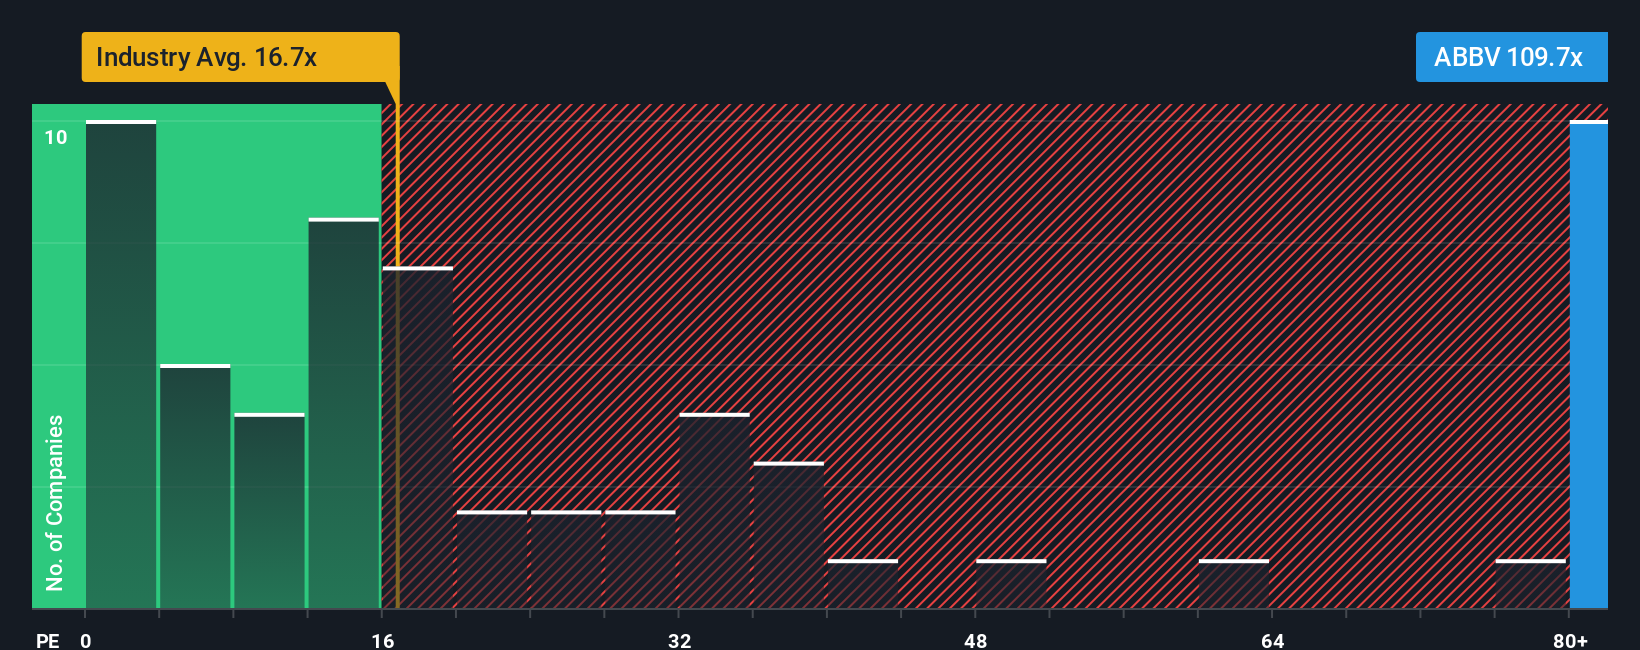
AbbVie currently trades on a P/E of 96.82x, compared with the Biotechs industry average of 22.20x and a peer average of 24.55x. Simply Wall St’s “Fair Ratio” for AbbVie is 38.64x. This proprietary metric aims to estimate an appropriate P/E for the company by tying together factors such as earnings growth, profit margins, industry, market cap and specific risk characteristics.
Because the Fair Ratio is tailored to AbbVie, it can be more informative than a broad industry or peer comparison, which treats very different companies as if they were identical. In this case, AbbVie’s current P/E of 96.82x sits well above the 38.64x Fair Ratio. This points to the shares looking expensive on this measure.
Result: OVERVALUED
P/E ratios tell one story, but what if the real opportunity lies elsewhere? Start investing in legacies, not executives. Discover our 23 top founder-led companies.
Upgrade Your Decision Making: Choose your AbbVie Narrative
Earlier we mentioned that there is an even better way to understand valuation. On Simply Wall St’s Community page you can use Narratives to turn your own story about AbbVie into a set of revenue, earnings and margin forecasts. For example, you might have a more confident view that its immunology and neuroscience pipeline, international growth and margins justify a fair value near US$255. Alternatively, you might take a more cautious stance that competition, pricing pressure and concentration risk cap fair value closer to US$170. These narratives link directly to a fair value estimate, update automatically when fresh news or earnings arrive, and can be compared against the current share price to help you decide whether the stock looks attractively or fully priced based on your assumptions.
Do you think there's more to the story for AbbVie? Head over to our Community to see what others are saying!
This article by Simply Wall St is general in nature. We provide commentary based on historical data and analyst forecasts only using an unbiased methodology and our articles are not intended to be financial advice. It does not constitute a recommendation to buy or sell any stock, and does not take account of your objectives, or your financial situation. We aim to bring you long-term focused analysis driven by fundamental data. Note that our analysis may not factor in the latest price-sensitive company announcements or qualitative material. Simply Wall St has no position in any stocks mentioned.