Is It Too Late To Consider Airbnb (ABNB) After Mixed Returns And Regulatory Debates?
Airbnb, Inc. ABNB | 0.00 |
- Wondering whether Airbnb's share price still offers value, or if most of the opportunity is already in the rear view mirror, starts with a clear look at what you are paying for today.
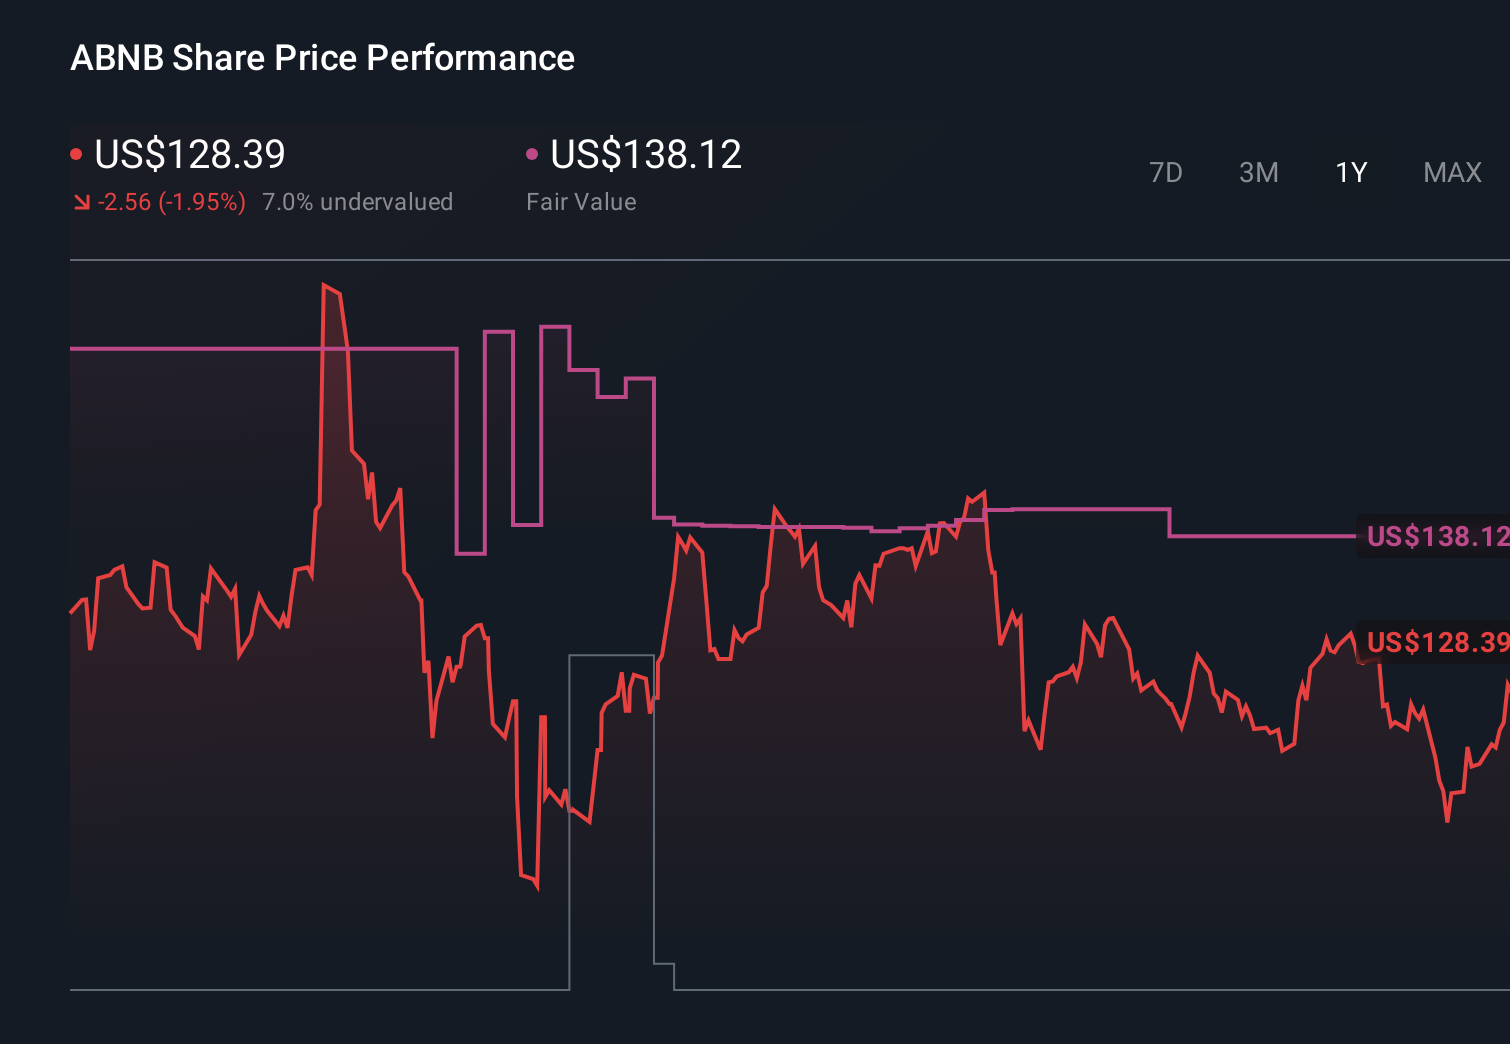
- Airbnb's stock recently closed at US$140.07, with returns of 1.5% over 7 days, 9.1% over 30 days, 5.3% year to date, 9.8% over 1 year and 38.3% over 3 years, alongside a 19.4% decline over 5 years.
- Recent headlines around Airbnb have focused on broader discussions about travel demand, regulatory scrutiny in key cities and how short term rentals fit alongside traditional hotels. Together, these themes help frame why the share price has moved the way it has and what the market might be weighing up in the period ahead.
- On our valuation checks, Airbnb currently scores 2 out of 6. We will walk through standard valuation approaches shortly and then finish by showing you a more complete way to think about what that score really means.
Airbnb scores just 2/6 on our valuation checks. See what other red flags we found in the full valuation breakdown.
Approach 1: Airbnb Discounted Cash Flow (DCF) Analysis
A Discounted Cash Flow, or DCF, model takes projected future cash flows and discounts them back to today to estimate what the entire business could be worth right now.
For Airbnb, the model uses a 2 Stage Free Cash Flow to Equity approach based on cash flow projections. The latest twelve month free cash flow is about US$4.6b. Analyst estimates and extrapolated forecasts point to projected free cash flow of roughly US$7.2b by 2030, with a series of annual projections in between that are discounted to reflect risk and the time value of money.
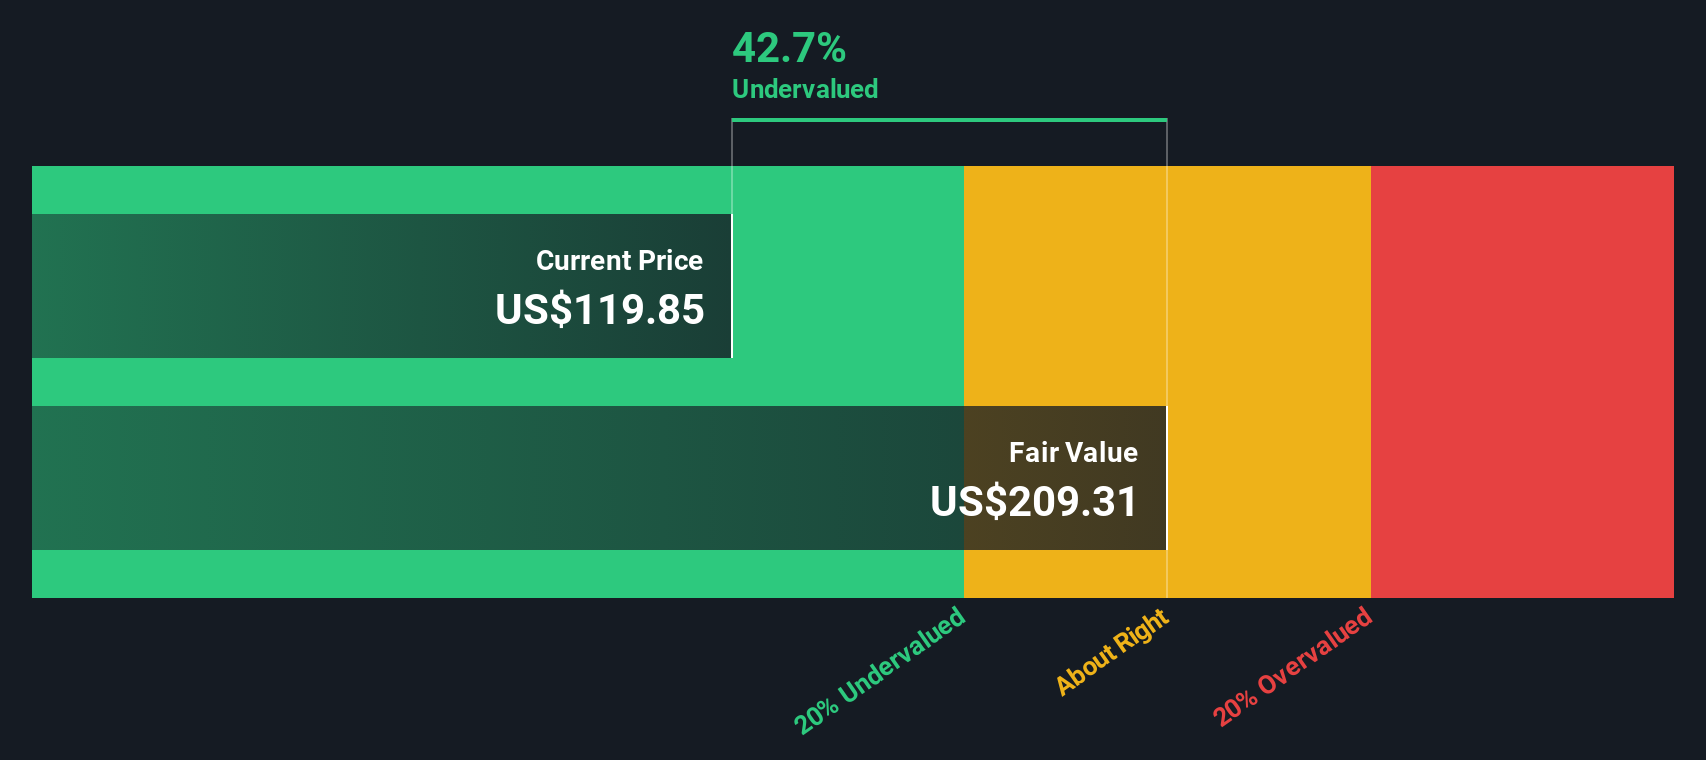
When all those discounted cash flows are added together, the DCF model arrives at an estimated intrinsic value of about US$195.18 per share, compared with the recent share price of US$140.07. That indicates the shares are trading at a 28.2% discount to this cash flow based estimate.
Result: UNDERVALUED
Our Discounted Cash Flow (DCF) analysis suggests Airbnb is undervalued by 28.2%. Track this in your watchlist or portfolio, or discover 885 more undervalued stocks based on cash flows.
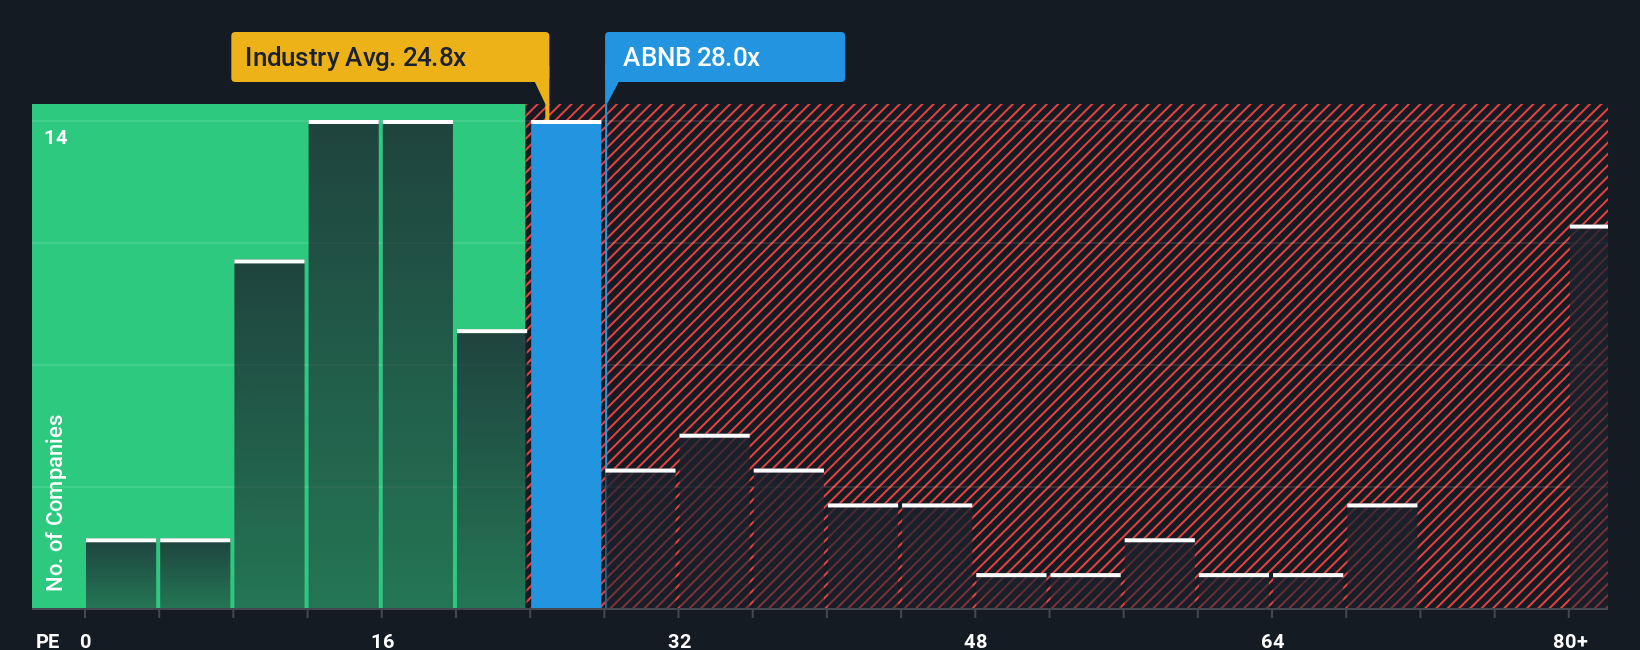
Approach 2: Airbnb Price vs Earnings
P/E is the go to multiple for a profitable business because it links what you pay per share directly to the earnings that belong to you as a shareholder. It is a quick way to see how many dollars investors are currently willing to pay for each dollar of earnings.
What counts as a reasonable P/E depends on how the market views a company’s growth potential and risk. Higher expected growth or more predictable earnings can support a higher P/E, while more uncertainty or weaker profitability usually means a lower one.
Airbnb currently trades on a P/E of 32.28x. That is close to the peer average of 32.17x and above the broader Hospitality industry average of 21.59x. This suggests investors are pricing the company differently to the typical hotel or travel operator.
Simply Wall St’s Fair Ratio for Airbnb is 30.74x. This is a proprietary estimate of what Airbnb’s P/E might be, given its earnings profile, industry, margins, market value and risk characteristics. It goes a step further than simple peer or industry comparisons by adjusting for these business specific inputs. Compared with the current P/E of 32.28x, the Fair Ratio points to the shares looking slightly overvalued on this metric.
Result: OVERVALUED
P/E ratios tell one story, but what if the real opportunity lies elsewhere? Discover 1443 companies where insiders are betting big on explosive growth.
Upgrade Your Decision Making: Choose your Airbnb Narrative
Earlier we mentioned that there is an even better way to understand valuation, so on Simply Wall St you can use Narratives. You and other investors can connect a clear story about Airbnb to specific forecasts for revenue, earnings, margins and a fair value. You can then see that fair value update automatically as new earnings or news arrive, compare it with the current price to guide your own buy or sell decisions, and even see how different views line up. For example, one Airbnb Narrative on the Community page currently anchors around a fair value of about US$163.75 per share, while another is closer to US$173.85. These differences reflect varying assumptions about how its lifestyle platform, international expansion, AI product improvements and regulatory risks might play out.
For Airbnb however we will make it really easy for you with previews of two leading Airbnb Narratives:
Fair value: US$163.75
Valuation gap: about 14.4% below this fair value based on the recent price of US$140.07
Revenue growth assumption: 12%
- Sees Airbnb shifting from a pure travel app to a broader lifestyle platform, spanning short stays, long term rentals and experiences.
- Highlights faster progress in international markets, ongoing product and AI upgrades, and strong free cash flow, while flagging regulation and taxes as key risks.
- Points out areas where the business may still be underdeveloped, such as guest fees, loyalty and the Experiences segment, which are treated as upside options rather than core drivers.
Fair value: US$138.12
Valuation gap: about 1.4% above this fair value based on the recent price of US$140.07
Revenue growth assumption: 10.1%
- Builds on expectations for ongoing revenue and earnings growth from remote work, longer stays and new regions, but sees much of that already reflected in the current price.
- Emphasizes risks from regulation in major cities, slower progress in mature markets and uncertain payoffs from newer services and experiences.
- Frames the consensus analyst target and assumptions around margins, P/E and buybacks as reasonable but sensitive to how competition, marketing costs and policy risks play out over the next few years.
These two viewpoints give you a clear range to work with, so you can decide which assumptions feel closer to how you see Airbnb evolving and how that lines up with today’s share price.
Do you think there's more to the story for Airbnb? Head over to our Community to see what others are saying!
This article by Simply Wall St is general in nature. We provide commentary based on historical data and analyst forecasts only using an unbiased methodology and our articles are not intended to be financial advice. It does not constitute a recommendation to buy or sell any stock, and does not take account of your objectives, or your financial situation. We aim to bring you long-term focused analysis driven by fundamental data. Note that our analysis may not factor in the latest price-sensitive company announcements or qualitative material. Simply Wall St has no position in any stocks mentioned.