

Is It Too Late To Consider Amazon.com (AMZN) After A 39% One Year Rally?
Amazon.com, Inc. AMZN | 0.00 |
- If you are wondering whether Amazon.com at US$265.06 is still reasonably priced or already reflecting a lot of optimism, this breakdown will help you frame that question clearly.
- The stock has recorded returns of 3.9% over the last 7 days, 27.3% over the last 30 days, 17.0% year to date and 39.4% over the last year. This naturally raises questions about how much value is already reflected in the price.
- Recent news coverage has focused on Amazon.com's broad role across e commerce, cloud services and other segments. Commentary often links these business lines to changing expectations around the stock. That context is important when you look at the recent performance, because sentiment around these business areas can influence how investors think about what they are paying today.
- Amazon.com currently has a valuation score of 3 out of 6. The next sections will walk through how different valuation approaches interpret that score and suggest a more complete way to think about value that brings the whole picture together.
Approach 1: Amazon.com Discounted Cash Flow (DCF) Analysis
A Discounted Cash Flow, or DCF, model takes estimates of the cash a company could generate in the future and discounts those cash flows back to what they might be worth in today's dollars. It is essentially asking what a stream of future cash flows could reasonably be worth now.
For Amazon.com, the model used here is a 2 Stage Free Cash Flow to Equity approach, based on cash flow projections. The latest twelve month Free Cash Flow is about $37.1b. Analysts contribute Free Cash Flow estimates for the next few years, and Simply Wall St extrapolates these further out. On that basis, projected Free Cash Flow for 2030 is $208.5b, with a series of annual projections between now and 2035, all expressed in $ and discounted back to today.
When those discounted cash flows are added up, the resulting estimated intrinsic value is $450.28 per share. Compared with the current share price of $265.06, the model implies an intrinsic discount of 41.1%, so the shares screen as undervalued on this DCF view.
Result: UNDERVALUED
Our Discounted Cash Flow (DCF) analysis suggests Amazon.com is undervalued by 41.1%. Track this in your watchlist or portfolio, or discover 51 more high quality undervalued stocks.

Approach 2: Amazon.com Price vs Earnings
For a profitable company, the P/E ratio is a useful shorthand for how much investors are currently paying for each dollar of earnings. It is simple to read, and it ties the share price directly to the bottom line, which is usually what drives long term returns.
What counts as a “normal” P/E partly depends on how quickly earnings are expected to grow and how risky those earnings appear. Higher growth expectations and lower perceived risk usually support a higher P/E, while weaker growth and higher risk tend to be reflected in a lower multiple.
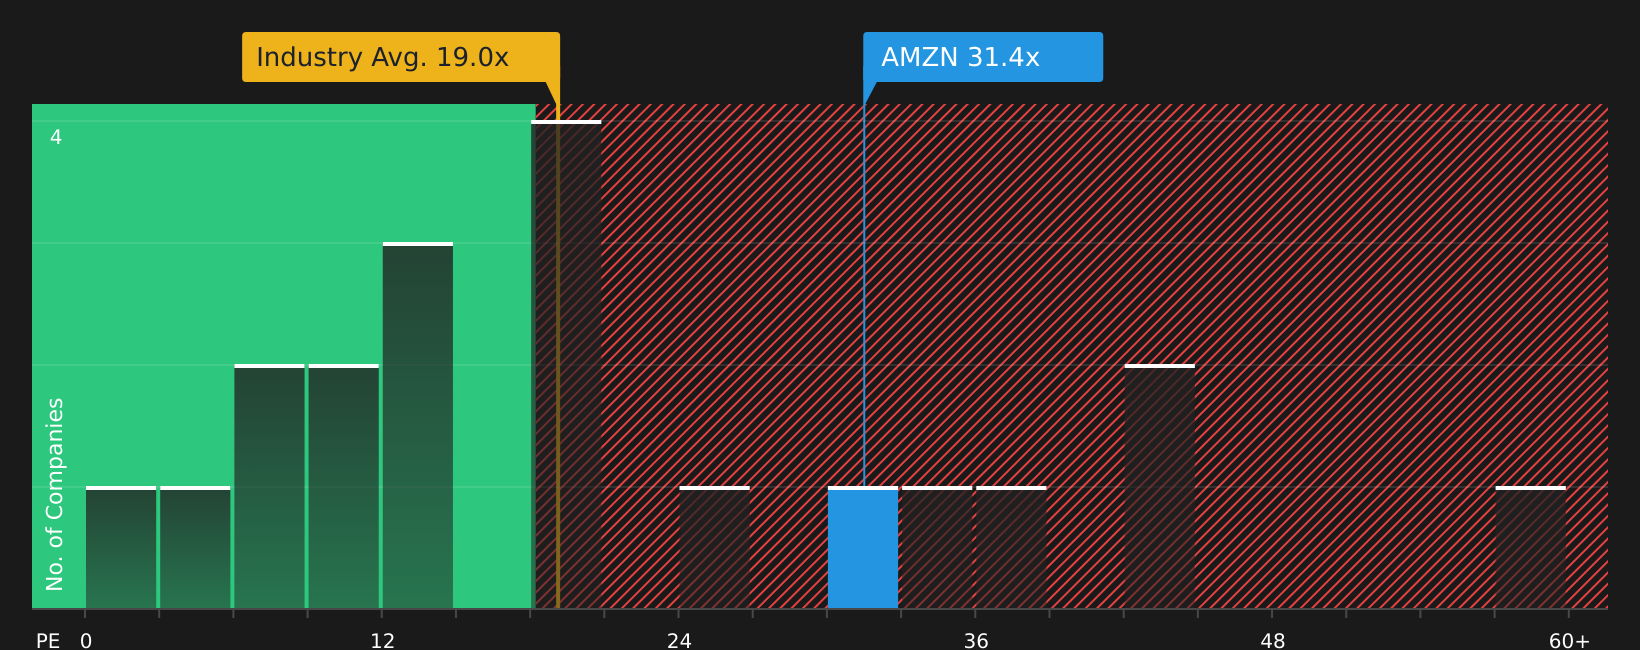
Amazon.com currently trades on a P/E of 31.4x. That is above the Multiline Retail industry average P/E of 19.5x and above the peer group average of 27.5x. Simply Wall St also calculates a proprietary “Fair Ratio” for Amazon.com of 38.6x, which is the P/E that would be expected given factors such as its earnings growth profile, industry, profit margins, market value and specific risks.
This Fair Ratio is more tailored than simple peer or industry comparisons because it adjusts for company specific characteristics rather than assuming all retailers deserve similar multiples. Comparing the current P/E of 31.4x with the Fair Ratio of 38.6x points to Amazon.com trading below that modeled level.
Result: UNDERVALUED
P/E ratios tell one story, but what if the real opportunity lies elsewhere? Start investing in legacies, not executives. Discover our 18 top founder-led companies.
Upgrade Your Decision Making: Choose your Amazon.com Narrative
Earlier we mentioned that there is an even better way to understand valuation. This is where Narratives come in, a simple way for you to attach a clear story about Amazon.com to the numbers you think are fair for its future revenue, earnings and margins.
A Narrative is essentially your view of how the business evolves, linked directly to a financial forecast and then to a fair value. Instead of only looking at a P/E or DCF output, you see why those numbers make sense for you.
On Simply Wall St, Narratives live in the Community page and are designed to be easy to set up. You can pick assumptions, see the implied fair value, and compare that with the current price to help you decide whether Amazon.com looks attractive, fully priced or expensive on your view, without needing a spreadsheet.
Because Narratives on the platform update when new information such as news or earnings is added, your story and fair value stay current rather than frozen at the time you first ran the numbers.
For example, one Amazon.com Narrative on Simply Wall St assumes a fair value of US$151.21 with margins of 10.0% and revenue growth of 7.2%, while another assumes a fair value of US$500.00 with margins of 8.0416% and revenue growth of 17.32%. This shows how two investors using the same company can reach very different, but clearly explained, conclusions about what the shares are worth.
For Amazon.com however we will make it really easy for you with previews of two leading Amazon.com Narratives:
Fair value: US$450.00 per share
Implied discount to that fair value: 41.1%
Revenue growth assumption: 8.95%
- The author frames current margin pressure as a choice to invest heavily in AI infrastructure, advertising and automated commerce, with the aim of strengthening long term earnings power.
- AWS, advertising and a more efficient retail operation are presented as the main profit engines, with AI related products and tools positioned as ways to deepen customer relationships.
- The valuation of US$450.00 per share is based on the view that current spending temporarily weighs on reported margins while underlying business economics and future earnings capacity remain strong.
Fair value: US$222.55 per share
Implied premium to that fair value: 19.1%
Revenue growth assumption: 15.19%
- This narrative highlights how earnings power is tied to third party sellers, advertising and AWS, but also points out that heavy reinvestment can suppress free cash flow for extended periods.
- The author expects continued growth in core segments like online retail, cloud and advertising, while treating areas such as subscriptions as support for the ecosystem rather than profit centers.
- At a fair value of US$222.55 per share, the conclusion is that current pricing already reflects strong long term growth and margin assumptions, leaving less room for upside on this set of forecasts.
Taken together, these two Narratives give you a practical range of outcomes to compare with your own expectations around Amazon.com's growth, reinvestment and profitability profile.
If you want to see how other investors are framing their assumptions, along with the detailed numbers behind their projections, it is worth reviewing more of the Community Narratives and tracking how they evolve as new information comes through.
To see how these results tie into long-term growth, risks, and valuation, check out the full range of community narratives for Amazon.com on Simply Wall St. Add the company to your watchlist or portfolio so you'll be alerted when the story evolves.
Do you think there's more to the story for Amazon.com? Head over to our Community to see what others are saying!

This article by Simply Wall St is general in nature. We provide commentary based on historical data and analyst forecasts only using an unbiased methodology and our articles are not intended to be financial advice. It does not constitute a recommendation to buy or sell any stock, and does not take account of your objectives, or your financial situation. We aim to bring you long-term focused analysis driven by fundamental data. Note that our analysis may not factor in the latest price-sensitive company announcements or qualitative material. Simply Wall St has no position in any stocks mentioned.