

Is It Too Late To Consider Amazon.com (AMZN) After Its Strong Multi‑Year Run?
Amazon.com AMZN | 0.00 |
- Wondering if Amazon.com at US$266.32 is still offering value after a long run as a market heavyweight? This article focuses on what the current price might be implying about the stock.
- The stock has returned 0.6% over the past week, 0.9% over the last month, 17.6% year to date and 32.5% over the past year, with a 3 year return of 121.7% and a 5 year return of 65.3%.
- Recent attention around Amazon.com continues to center on its role in retail and digital services, as investors track how the business responds to changing consumer behavior and competitive pressures. These themes provide useful context when thinking about how the current share price relates to the underlying business.
- On Simply Wall St's 6 point valuation checklist, Amazon.com scores 3, which means it screens as undervalued on half of the checks. Next comes a closer look at the main valuation methods used for this stock and, later in the article, a way of thinking about valuation that ties them together more clearly.
Approach 1: Amazon.com Discounted Cash Flow (DCF) Analysis
A Discounted Cash Flow, or DCF, model estimates what a stock could be worth by projecting its future cash flows and then discounting those back to today using a required return. It is essentially asking what future cash generated by the business is worth in today’s dollars.
For Amazon.com, the model used is a 2 Stage Free Cash Flow to Equity approach. The latest twelve month Free Cash Flow is about $37.13b. Analysts provide detailed forecasts for several years, and Simply Wall St extends those projections further, with projected Free Cash Flow of about $175.95b in 2030, discounted to today’s terms in the model.
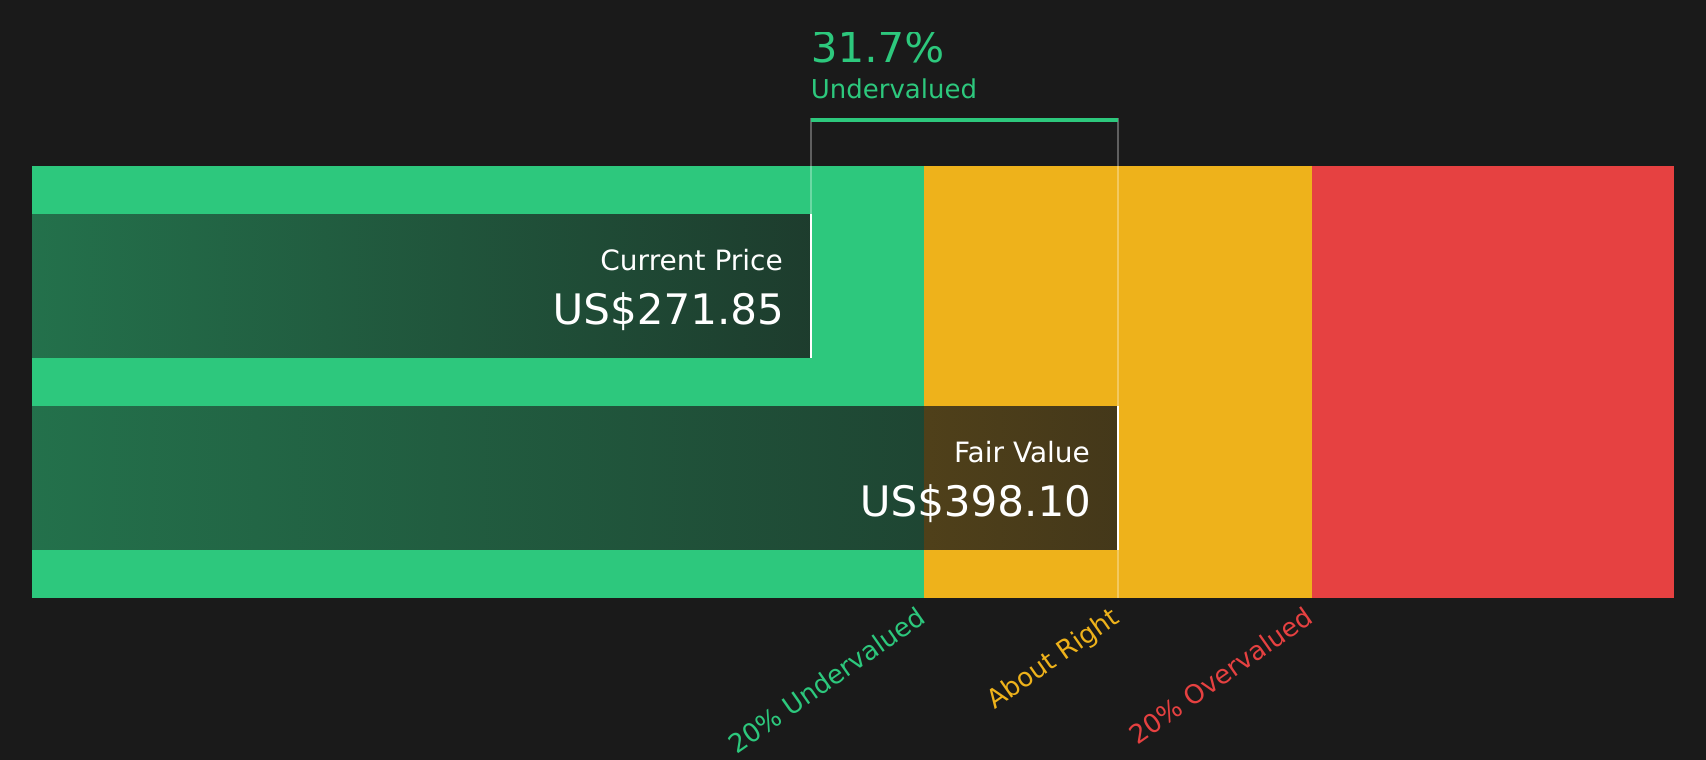
Bringing all those projected cash flows together, the DCF model arrives at an estimated intrinsic value of $398.20 per share. Compared with the current share price of $266.32, this implies the stock is trading at about a 33.1% discount to that estimate, which indicates the shares appear undervalued on this measure.
Result: UNDERVALUED
Our Discounted Cash Flow (DCF) analysis suggests Amazon.com is undervalued by 33.1%. Track this in your watchlist or portfolio, or discover 48 more high quality undervalued stocks.
Approach 2: Amazon.com Price vs Earnings
For profitable companies, the P/E ratio is a useful shortcut because it links what you pay for each share directly to the earnings that support that share. Investors usually expect higher growth or lower perceived risk to justify a higher P/E, while slower growth or higher risk tends to line up with a lower, more conservative P/E.
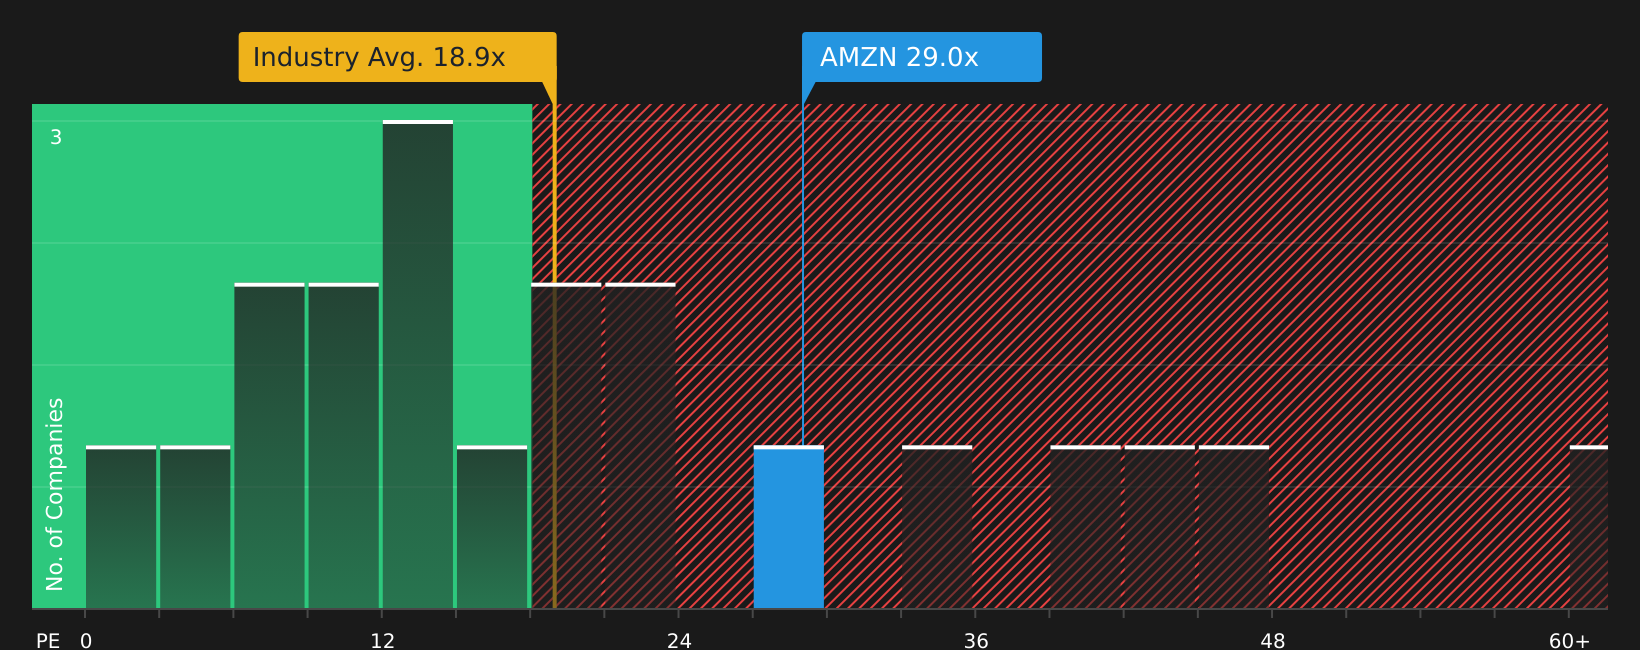
Amazon.com is trading on a P/E of 31.55x. That sits above the Multiline Retail industry average of 18.92x and also above the selected peer average of 24.49x, which suggests the stock is priced at a higher multiple of earnings than many sector peers. On its own, that spread does not say whether the stock is expensive or justified, because it does not factor in company specific growth prospects, profitability and risk.
To address that, Simply Wall St uses a proprietary Fair Ratio, which estimates what a more tailored P/E might be after considering earnings growth, profit margins, risk profile, market capitalization and the industry context. For Amazon.com, this Fair Ratio is 41.45x, which is higher than the current P/E of 31.55x. On this metric, the stock appears to be trading below that tailored estimate.
Result: UNDERVALUED
P/E ratios tell one story, but what if the real opportunity lies elsewhere? Start investing in legacies, not executives. Discover our 20 top founder-led companies.
Upgrade Your Decision Making: Choose your Amazon.com Narrative
Earlier it was mentioned that there is an even better way to understand valuation, so this is where Narratives come in. They let you attach a clear story about Amazon.com to the numbers you care about by connecting your view of its future revenue, earnings and margins to a forecast and then to a Fair Value that can be compared with today’s US$266.32 share price.
On Simply Wall St’s Community page, Narratives are simple to use because you pick assumptions instead of formulas. The platform, which is used by millions of investors, automatically links your story to a full financial model, updates it when new results or news arrive, and shows whether your Fair Value implies that the stock looks expensive or cheap at the current price.
For Amazon.com, one investor Narrative currently assumes a Fair Value of US$141.18 while another assumes US$500.00. These reflect very different views on how AWS, advertising and retail margins might develop. Narratives make those differences transparent so you can see exactly which expectations, and which resulting Fair Value, you are most comfortable using in your own decision making.
For Amazon.com however we will make it really easy for you with previews of two leading Amazon.com Narratives:
Fair Value: US$450.00 per share
Current price vs this Fair Value: about 40.8% below this narrative estimate
Revenue growth assumption: 8.95%
- Sees Amazon intentionally keeping margins lower while it spends heavily on AI infrastructure, chips, logistics automation and software. The view is that these investments increase future earnings capacity.
- Highlights AWS, advertising and more efficient retail operations as the main profit engines, with AI tools and custom silicon aimed at keeping large customers on the platform for the long term.
- Argues that the market is underestimating how these spending decisions could translate into higher operating income over time. This is why this narrative uses a Fair Value of US$450.00.
Fair Value: US$222.55 per share
Current price vs this Fair Value: about 19.6% above this narrative estimate
Revenue growth assumption: 15.19%
- Emphasizes that Amazon’s reported profits sit below its underlying earnings power, with third party sellers, AWS and advertising doing much of the heavy lifting.
- Assumes continued heavy reinvestment into fulfillment, cloud and logistics that keeps free cash flow and reported profitability under pressure while the company builds out its global footprint.
- Frames US$222.55 as a Fair Value that already bakes in strong revenue growth assumptions across major segments. This means any slower delivery on those assumptions could leave less room for upside from today’s price.
If you want to see how other investors are joining the dots between these kinds of stories and valuation, it is worth looking at the wider range of community views on Amazon.com too, including how they handle risks, cash flows and the role of AI across the business.To see how these results tie into long-term growth, risks, and valuation, check out the full range of community narratives for Amazon.com on Simply Wall St. Add the company to your watchlist or portfolio so you'll be alerted when the story evolves.
Do you think there's more to the story for Amazon.com? Head over to our Community to see what others are saying!

This article by Simply Wall St is general in nature. We provide commentary based on historical data and analyst forecasts only using an unbiased methodology and our articles are not intended to be financial advice. It does not constitute a recommendation to buy or sell any stock, and does not take account of your objectives, or your financial situation. We aim to bring you long-term focused analysis driven by fundamental data. Note that our analysis may not factor in the latest price-sensitive company announcements or qualitative material. Simply Wall St has no position in any stocks mentioned.