Is It Too Late To Consider Applied Materials (AMAT) After 72% One Year Rally?
Applied Materials, Inc. AMAT | 0.00 |
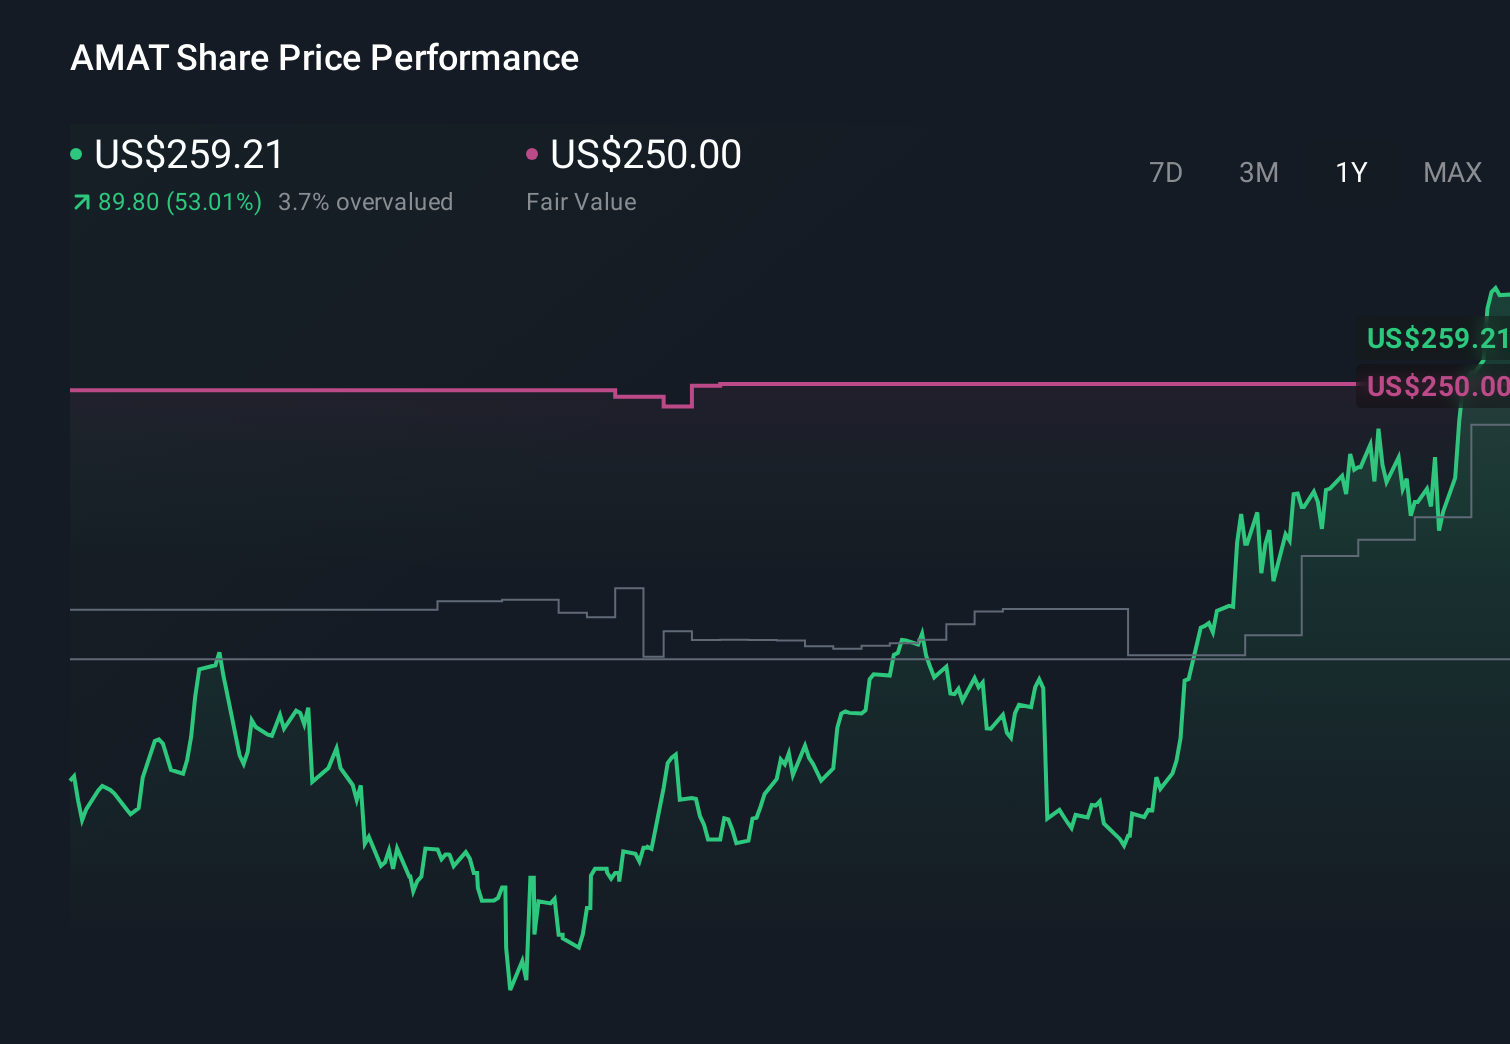
- If you are wondering whether Applied Materials at around US$325.24 is still reasonably priced or starting to look stretched, the next sections will walk through what the current share price might be implying.
- The stock has recently recorded returns of 1.9% over 7 days, 25.0% over 30 days, 21.0% year to date and 72.3% over 1 year, with 3 year and 5 year returns of 189.1% and 235.8% respectively. This has many investors asking what is already baked into the price.
- Alongside this share price performance, recent news coverage has focused on Applied Materials as a key player in the semiconductor equipment space, often citing its role in chip manufacturing capacity and technology spending. That context helps explain why sentiment around the stock has been so closely watched as investors assess how sustainable these trends might be.
- On our checks, Applied Materials scores 2 out of 6 on valuation, with the full breakdown available in our valuation score. Next we compare different ways to look at value before finishing with a framework that can help you build an even clearer picture.
Applied Materials scores just 2/6 on our valuation checks. See what other red flags we found in the full valuation breakdown.
Approach 1: Applied Materials Discounted Cash Flow (DCF) Analysis
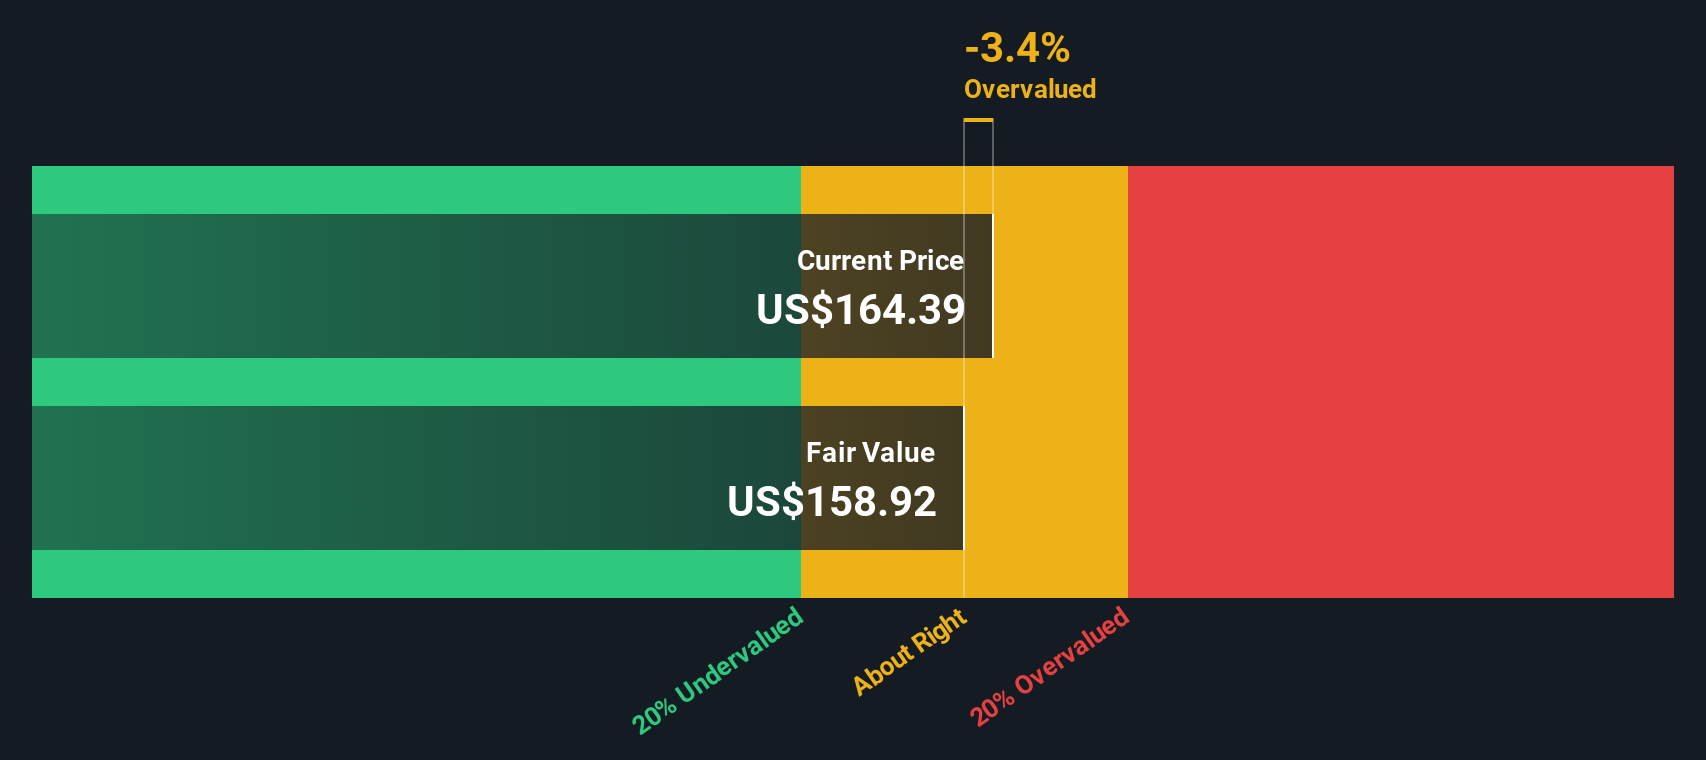
A Discounted Cash Flow model projects a company’s future cash flows and then discounts them back to today’s value to estimate what the business might be worth right now. For Applied Materials, the model used is a 2 Stage Free Cash Flow to Equity approach, based on cash flows available to shareholders.
The latest twelve month free cash flow is about $6.38b. Analyst based projections and subsequent extrapolations by Simply Wall St suggest free cash flows in the $5.74b to $11.53b range over the next decade, with a specific projection of $9.29b in 2030. These future cash flows are discounted back to today using a required return, giving an estimated intrinsic value of about $139.91 per share.
Compared with a current share price of around $325.24, this implies the stock is roughly 132.5% above the DCF based estimate. This indicates that Applied Materials may be trading at a premium relative to what this cash flow model suggests.
Result: OVERVALUED
Our Discounted Cash Flow (DCF) analysis suggests Applied Materials may be overvalued by 132.5%. Discover 882 undervalued stocks or create your own screener to find better value opportunities.
Approach 2: Applied Materials Price vs Earnings
For profitable companies, the P/E ratio is a useful way to gauge what investors are willing to pay for each dollar of earnings. This makes it a practical cross check on the DCF view you just saw.
A “normal” or “fair” P/E typically reflects what investors expect for future growth and how much risk they see in those earnings. Higher expected growth or lower perceived risk can justify a higher P/E, while lower growth or higher risk usually calls for a lower one.
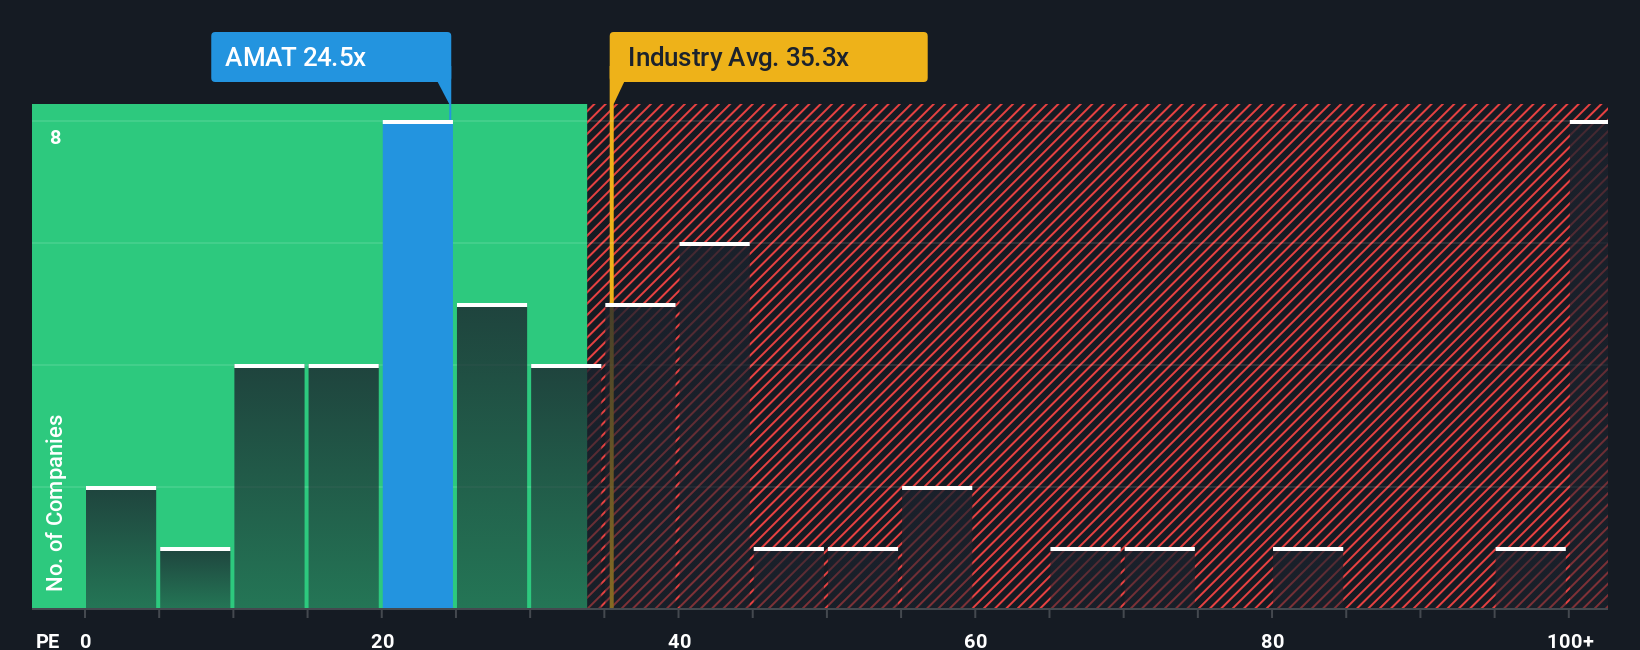
Applied Materials currently trades on a P/E of about 36.9x. That sits below the peer average of roughly 51.8x and also below the broader Semiconductor industry average of about 43.9x. Simply Wall St’s Fair Ratio for Applied Materials is 32.1x, which is its proprietary estimate of what the P/E might be, given the company’s earnings growth profile, industry, profit margins, market cap and risk characteristics.
The Fair Ratio can be more useful than a straight peer or industry comparison because it adjusts for those company specific factors rather than assuming one size fits all. Compared with this 32.1x Fair Ratio, the current 36.9x P/E suggests the shares are trading at a premium.
Result: OVERVALUED
P/E ratios tell one story, but what if the real opportunity lies elsewhere? Discover 1433 companies where insiders are betting big on explosive growth.
Upgrade Your Decision Making: Choose your Applied Materials Narrative
Earlier we mentioned that there is an even better way to understand valuation, so let us introduce you to Narratives, which let you attach a clear story, your view on future revenue, earnings and margins, to the numbers behind a fair value estimate.
A Narrative links what you believe about a company, for example how you think Applied Materials might perform in semiconductor equipment demand, to a set of financial forecasts and then straight through to a fair value that you can compare with today’s share price.
You can build and explore these Narratives on Simply Wall St’s Community page, where millions of investors share their views, so you can quickly see how your expectations stack up against others and use the fair value versus current price gap to help decide whether the stock fits your plan.
Because Narratives update automatically when new information such as earnings reports or news is added to the platform, one investor might run a cautious Narrative for Applied Materials with modest revenue growth and a lower fair value, while another uses higher long term growth assumptions and arrives at a much higher fair value, all using the same easy tool.
Do you think there's more to the story for Applied Materials? Head over to our Community to see what others are saying!
This article by Simply Wall St is general in nature. We provide commentary based on historical data and analyst forecasts only using an unbiased methodology and our articles are not intended to be financial advice. It does not constitute a recommendation to buy or sell any stock, and does not take account of your objectives, or your financial situation. We aim to bring you long-term focused analysis driven by fundamental data. Note that our analysis may not factor in the latest price-sensitive company announcements or qualitative material. Simply Wall St has no position in any stocks mentioned.