Is It Too Late To Consider Applied Materials (AMAT) After Its Strong Multi‑Year Rally?
Applied Materials, Inc. AMAT | 0.00 |
- If you are wondering whether Applied Materials' share price still offers value or if most of the upside has already been captured, the next sections are designed to help you frame that question clearly.
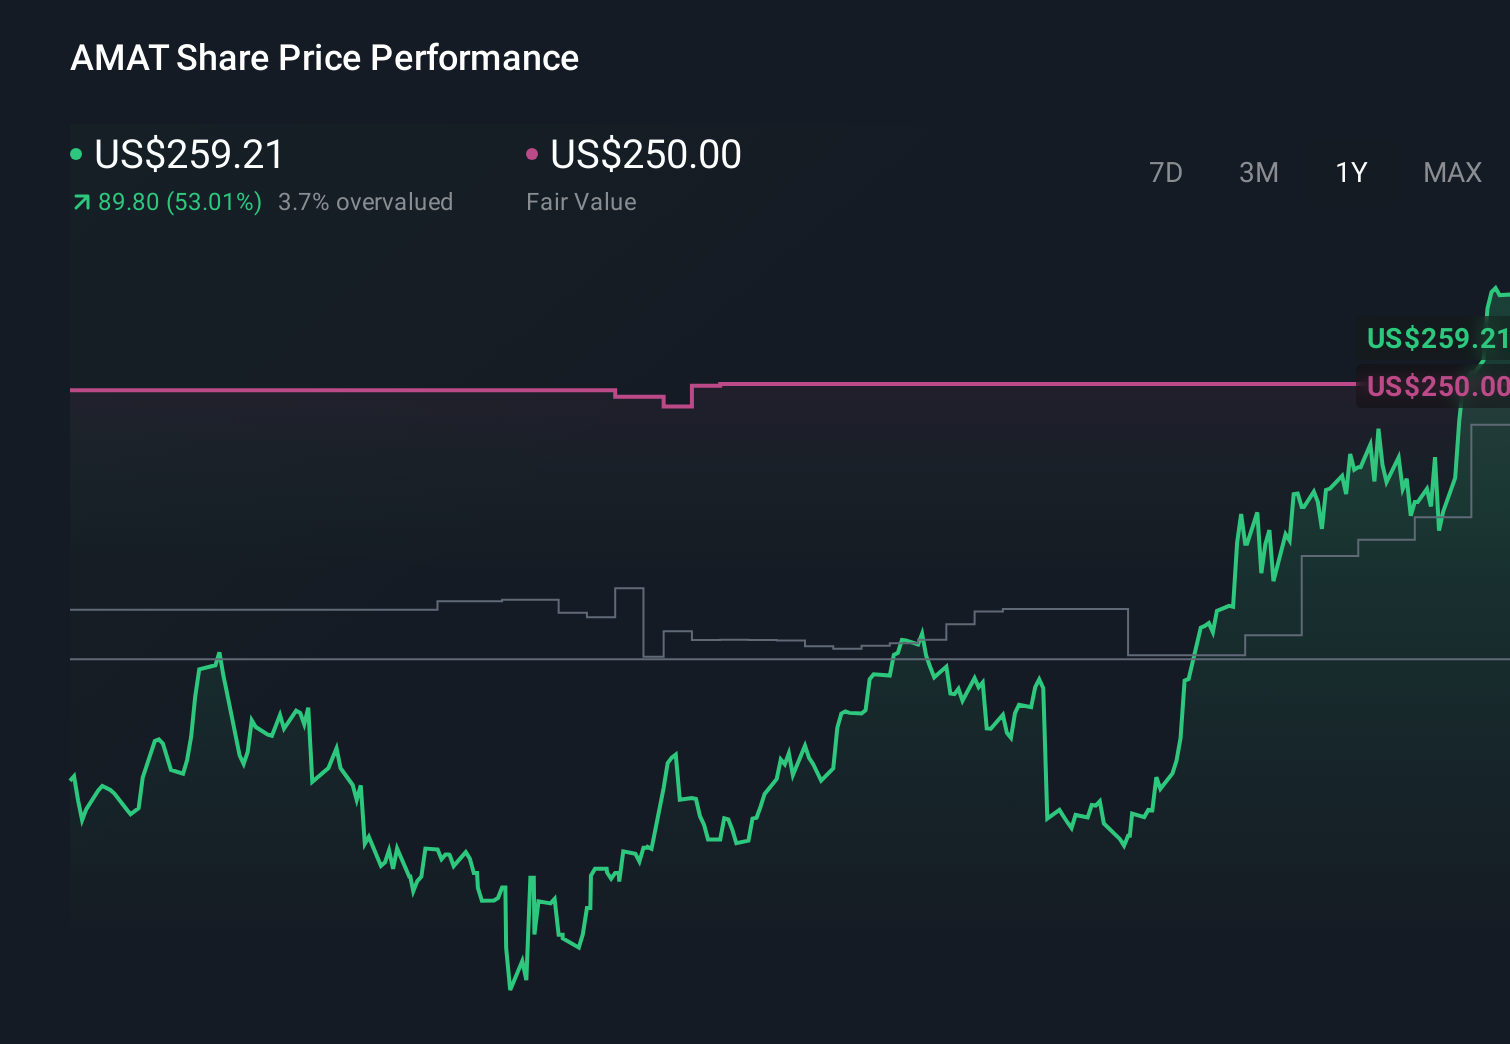
- The stock last closed at US$304.87, with returns of 3.0% over 7 days, 17.6% over 30 days, 13.4% year to date, 77.3% over 1 year and 191.5% over 5 years. These figures put recent moves firmly on investors' radar.
- Recent attention on semiconductor equipment suppliers, including Applied Materials, has been shaped by ongoing demand for advanced manufacturing capacity and policy support for chip production in key regions. This backdrop has kept investors closely focused on companies that sit at the heart of the chip supply chain and on their ability to serve that demand efficiently.
- Applied Materials currently has a valuation score of 2 / 6, which means it screens as undervalued on 2 of 6 valuation checks. Next, we will look at what different valuation approaches say about that score and how a more holistic method later in the article can sharpen your view.
Applied Materials scores just 2/6 on our valuation checks. See what other red flags we found in the full valuation breakdown.
Approach 1: Applied Materials Discounted Cash Flow (DCF) Analysis
A Discounted Cash Flow, or DCF, model estimates what a company could be worth today by projecting its future cash flows and then discounting those back to a present value.
For Applied Materials, the model used is a 2 Stage Free Cash Flow to Equity approach. The company’s latest twelve month free cash flow is about US$6.38b. Analysts have provided explicit free cash flow estimates out to 2030, with projections such as US$5.72b in 2026 and US$9.29b in 2030. Beyond the first five years, Simply Wall St extrapolates the figures using gradually moderating growth assumptions. This is reflected in the ten year projection path.
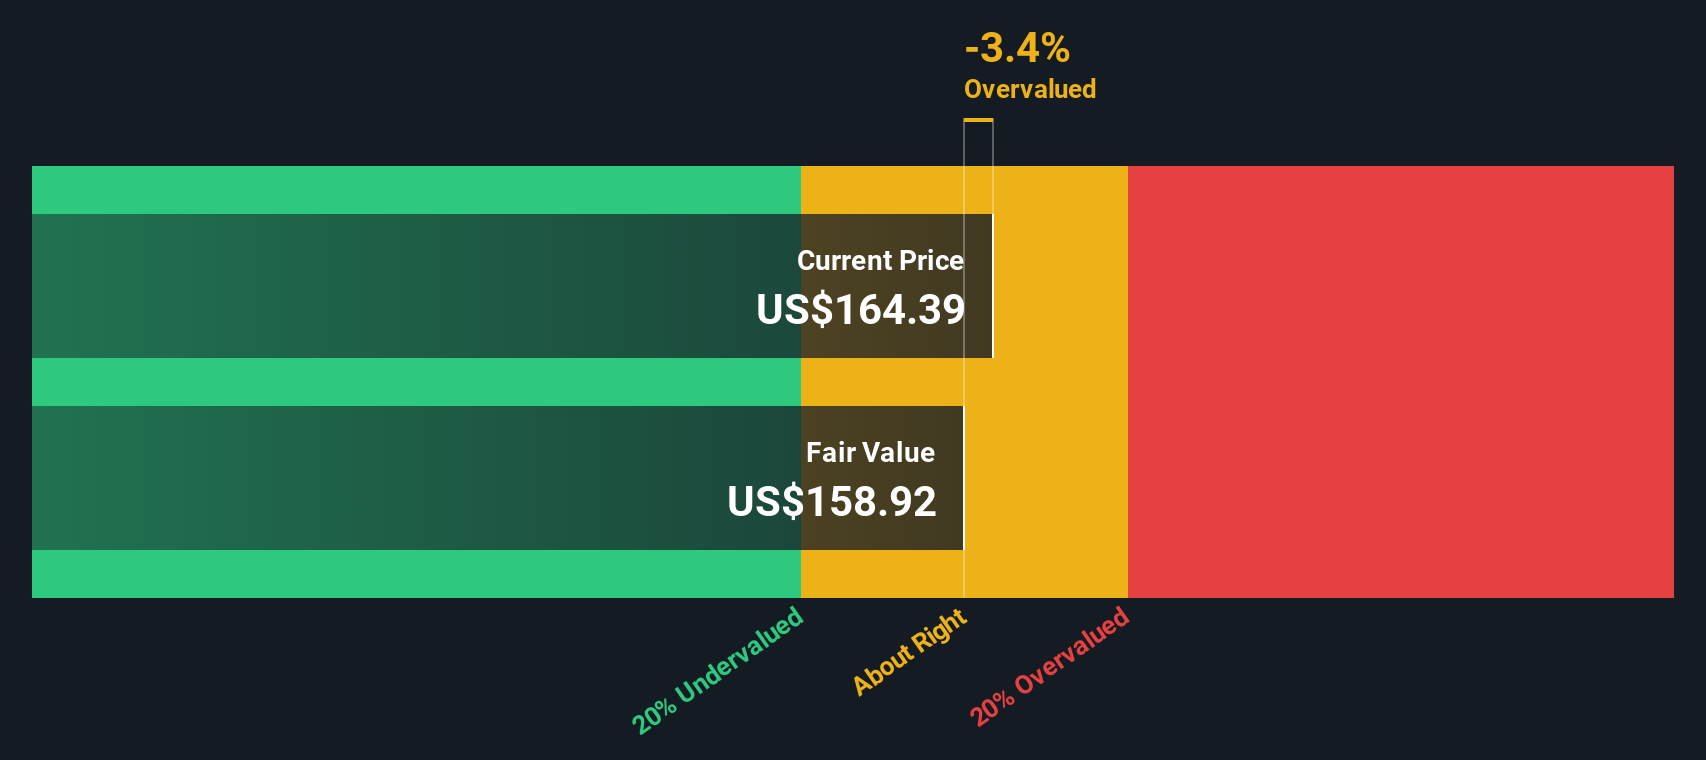
When all those projected cash flows are discounted back and combined, the DCF model outputs an estimated intrinsic value of US$139.71 per share. Compared with the recent share price of US$304.87, this implies the stock screens as 118.2% overvalued on this model alone.
Result: OVERVALUED
Our Discounted Cash Flow (DCF) analysis suggests Applied Materials may be overvalued by 118.2%. Discover 884 undervalued stocks or create your own screener to find better value opportunities.
Approach 2: Applied Materials Price vs Earnings
P/E is a useful way to look at profitable companies because it links what you pay for each share to the earnings that business is currently generating. It helps you see how much the market is willing to pay today for each dollar of earnings.
What counts as a “normal” P/E ratio often reflects two things: how quickly earnings are expected to grow and how risky those earnings are perceived to be. Higher expected growth or lower perceived risk can justify a higher P/E, while slower growth or higher risk usually points to a lower P/E.
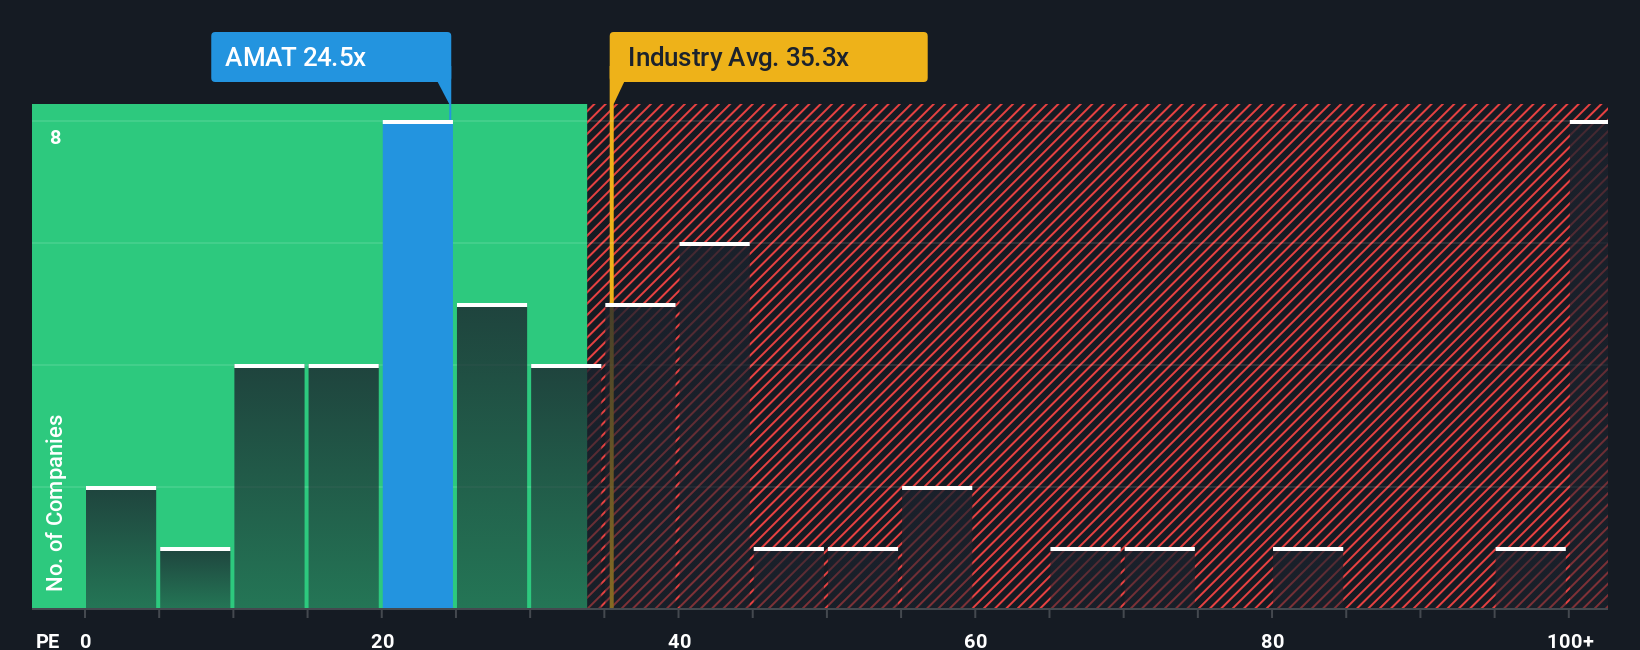
Applied Materials currently trades on a P/E of 34.54x. That sits below the Semiconductor industry average of 41.43x and below the peer group average of 50.32x, which suggests the stock is not priced at the top end of its group based on earnings alone.
Simply Wall St’s Fair Ratio for Applied Materials is 31.77x. This is a proprietary estimate of what a “justified” P/E could be given the company’s earnings growth profile, profit margins, size, industry and risk factors. Because it blends these company specific inputs, the Fair Ratio can be a more tailored guide than simple peer or industry comparisons.
With the current P/E at 34.54x versus a Fair Ratio of 31.77x, the shares screen as trading somewhat above that Fair Ratio benchmark.
Result: OVERVALUED
P/E ratios tell one story, but what if the real opportunity lies elsewhere? Discover 1441 companies where insiders are betting big on explosive growth.
Upgrade Your Decision Making: Choose your Applied Materials Narrative
Earlier we mentioned that there is an even better way to understand valuation. On Simply Wall St’s Community page you can use Narratives, where you and other investors connect a clear story about Applied Materials to specific assumptions for future revenue, earnings, margins and a fair value. You can then compare that fair value to the current price, see how different Narratives can range from about US$194 per share to about US$248 per share, and watch those views update automatically when new news or earnings arrive. This gives you a living, story-backed framework to help decide whether the current market price lines up with the story you believe.
Do you think there's more to the story for Applied Materials? Head over to our Community to see what others are saying!
This article by Simply Wall St is general in nature. We provide commentary based on historical data and analyst forecasts only using an unbiased methodology and our articles are not intended to be financial advice. It does not constitute a recommendation to buy or sell any stock, and does not take account of your objectives, or your financial situation. We aim to bring you long-term focused analysis driven by fundamental data. Note that our analysis may not factor in the latest price-sensitive company announcements or qualitative material. Simply Wall St has no position in any stocks mentioned.