

Is It Too Late To Consider Fastenal (FAST) After Its Strong Multi Year Share Price Run?
Fastenal Company FAST | 0.00 |
- Wondering whether Fastenal's current share price still makes sense for you, or if the value case is starting to look stretched.
- The stock closed at US$45.78, with a 6.9% decline over the last 7 days, a 1.6% gain over 30 days, 13.2% year to date, 14.6% over 1 year, 79.8% over 3 years and 96.8% over 5 years. This gives you a mixed set of signals on recent momentum and risk perception.
- Recent coverage has focused on Fastenal's role as a large industrial distributor and its positioning in supply chains, which helps frame how investors think about its resilience and pricing power. Broader commentary has also highlighted how consistent demand for maintenance and construction supplies can influence sentiment around stocks in this part of the market.
- On Simply Wall St's 6 point valuation checklist, Fastenal currently scores 0 out of 6. The sections ahead will walk through what that means using common valuation tools like P/E and DCF, and then finish with a different way of thinking about value that ties everything together.
Fastenal scores just 0/6 on our valuation checks. See what other red flags we found in the full valuation breakdown.
Approach 1: Fastenal Discounted Cash Flow (DCF) Analysis
A Discounted Cash Flow model takes estimates of the cash Fastenal could generate in the future and discounts those back to what they might be worth in today’s dollars. It is essentially asking what a rational buyer might pay now for all those future cash flows.
Fastenal’s latest twelve month free cash flow is about $1,170.8 million. Using a 2 Stage Free Cash Flow to Equity model, analyst estimates and extrapolated figures project free cash flow reaching $1,368 million by 2030, with interim projections between 2026 and 2035 stepping through the path from today to that level. All cash flows in this model are in $.
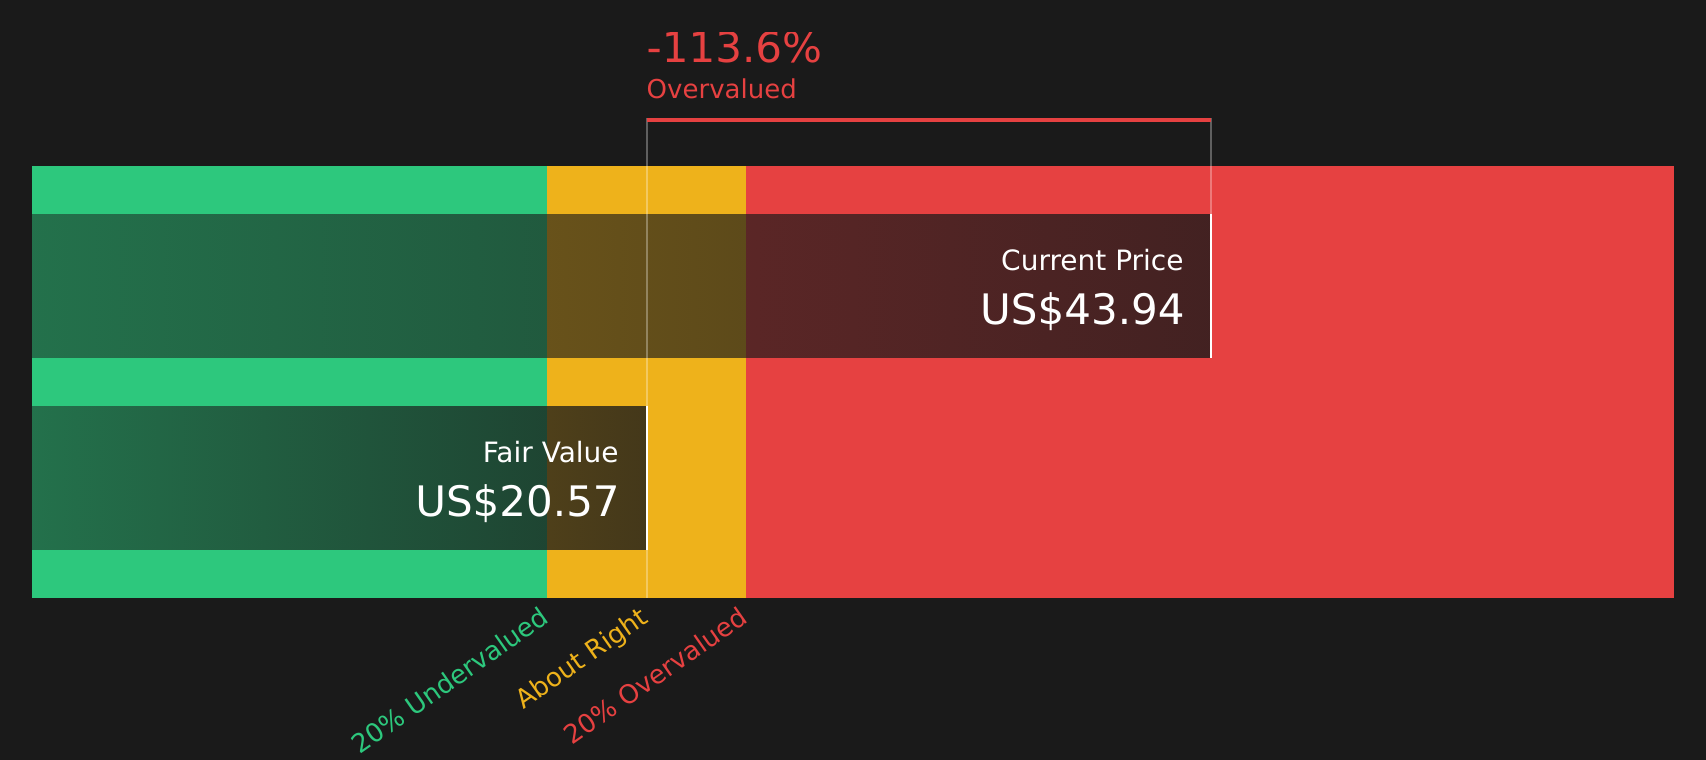
When those projected cash flows are discounted back, the model points to an estimated intrinsic value of about $20.98 per share. Compared with the recent share price of $45.78, this setup implies the stock is 118.2% overvalued on this particular DCF model, so the market price sits well above what this cash flow approach suggests.
Result: OVERVALUED
Our Discounted Cash Flow (DCF) analysis suggests Fastenal may be overvalued by 118.2%. Discover 59 high quality undervalued stocks or create your own screener to find better value opportunities.
Approach 2: Fastenal Price vs Earnings
For a consistently profitable company, the P/E ratio is a straightforward way to connect what you pay for each share with the earnings that share represents. It helps you see how many dollars investors are paying today for one dollar of current earnings.
What counts as a “normal” or “fair” P/E depends on how quickly earnings are expected to grow and how risky those earnings appear. Higher expected growth or lower perceived risk can support a higher P/E, while slower growth or higher risk tends to justify a lower one.
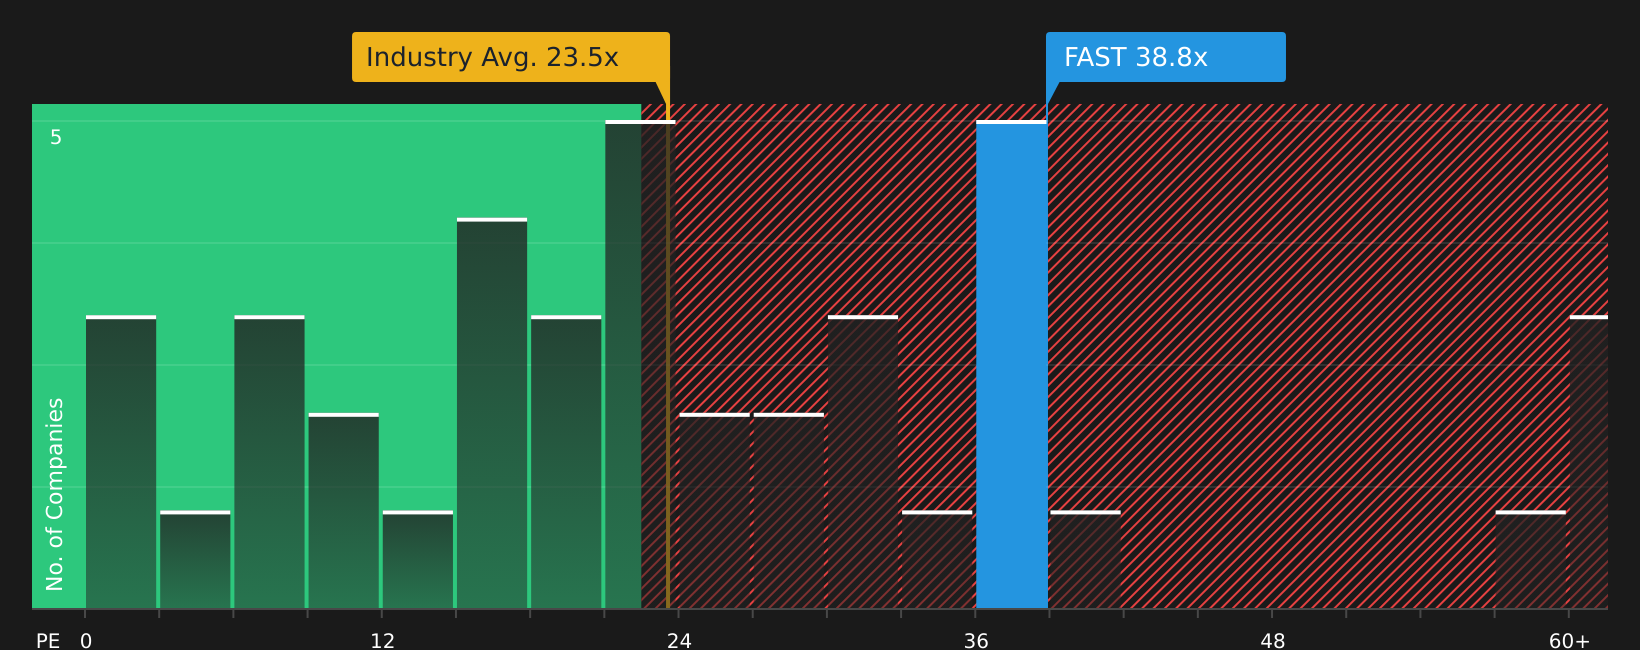
Fastenal currently trades on a P/E of 40.44x, compared with a Trade Distributors industry average of 23.20x and a peer group average of 24.28x. Simply Wall St’s Fair Ratio for Fastenal is 27.62x, which is an estimate of what its P/E might be given its earnings profile, industry, profit margins, size and risk characteristics.
This Fair Ratio is more tailored than a simple industry or peer comparison because it adjusts for company specific factors rather than treating all distributors as identical. When set against the current 40.44x P/E, the 27.62x Fair Ratio suggests Fastenal shares are pricing in a richer valuation than this framework implies.
Result: OVERVALUED
P/E ratios tell one story, but what if the real opportunity lies elsewhere? Start investing in legacies, not executives. Discover our 19 top founder-led companies.
Upgrade Your Decision Making: Choose your Fastenal Narrative
Earlier it was mentioned that there is an even better way to understand valuation, so Narratives are introduced, which are simple stories you choose about Fastenal’s future that link its business context, like expanding Fastenal Managed Inventory, digital sales and tariff risks, to specific forecasts for revenue, earnings and margins. These are then rolled into a fair value that you can compare with today’s price, all within Simply Wall St’s Community page where millions of investors share views. Narratives update automatically as new earnings, news or targets arrive. One investor might back a higher fair value closer to US$52 based on confidence in FMI growth and digital execution, while another might lean toward a lower fair value around US$38 because of concerns about tariffs, slower revenue assumptions or margin pressure. This gives you a clear, number backed way to decide whether Fastenal looks expensive or reasonable against your own story rather than relying only on a single P/E snapshot.
For Fastenal however we will make it really easy for you with previews of two leading Fastenal Narratives:
Start with the bullish case if you think the business can squeeze more growth and quality out of its current model, then balance that against a more measured view that assumes the current price already factors in a lot of good news.
These are not instructions to buy or sell, they are shortcuts to help you decide which story feels closer to your own expectations.
In this bullish narrative, the fair value is US$53.00 per share.
Compared with the last close at US$45.78, this is about 13.6% below the bullish fair value.
Revenue growth assumption: 10.66% a year.
- Assumes Fastenal can keep rolling out on site services and Fastenal Managed Inventory, lifting recurring revenue and tightening customer relationships.
- Leans on higher digital and automation usage, supply chain localization and re shoring to support revenue growth and margins over time.
- Accepts execution risks around e commerce, geographic expansion and potential commoditization but views them as manageable against the upside case.
In this more conservative narrative, the fair value is US$45.24 per share.
Compared with the last close at US$45.78, this is about 1.2% above the fair value used in this view.
Revenue growth assumption: 8.54% a year.
- Assumes Fastenal grows through FMI, digital channels and supply chain diversification, but at a pace that broadly lines up with current analyst targets.
- Highlights ongoing cost and margin pressures from tariffs, freight, SG&A and higher inventory needs, which may limit how much earnings can expand.
- Flags competition from digital purchasing platforms and changing customer behavior as key risks that could keep the valuation closer to fair than cheap.
If you want to see how other investors are weighing these trade offs and how the numbers shift as new data arrives, it is worth going straight to the community view and checking the full bull and bear Narratives side by side using See what the community is saying about Fastenal.
Do you think there's more to the story for Fastenal? Head over to our Community to see what others are saying!

This article by Simply Wall St is general in nature. We provide commentary based on historical data and analyst forecasts only using an unbiased methodology and our articles are not intended to be financial advice. It does not constitute a recommendation to buy or sell any stock, and does not take account of your objectives, or your financial situation. We aim to bring you long-term focused analysis driven by fundamental data. Note that our analysis may not factor in the latest price-sensitive company announcements or qualitative material. Simply Wall St has no position in any stocks mentioned.