Is It Too Late To Consider L3Harris Technologies (LHX) After A 73% One Year Surge?
L3Harris Technologies Inc LHX | 0.00 |
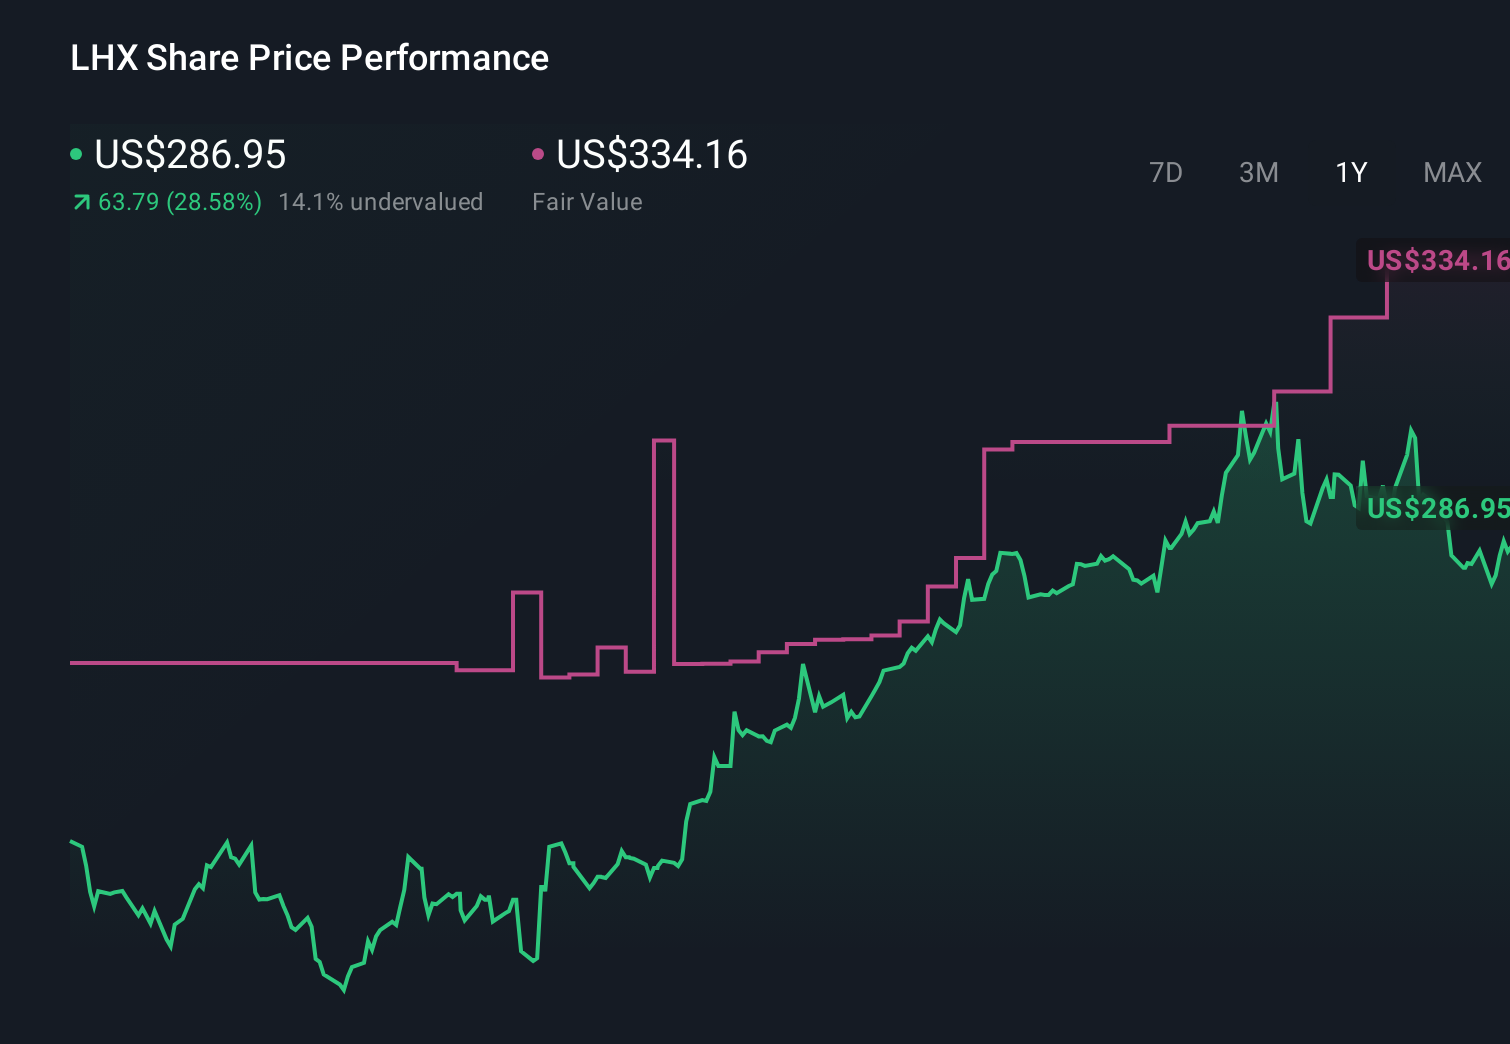
- For investors wondering whether L3Harris Technologies at around US$340 per share represents fair value, a bargain, or something in between, this article is designed to help answer that question using a clear valuation lens.
- The stock has a 7 day return of 0.4%, a 30 day return reflecting a 0.1% decline, an 11.8% year to date return, and a 72.9% return over 1 year. These figures may prompt many investors to consider whether the recent gains leave room for further upside or instead point to a shift in risk.
- Recent news around L3Harris has focused on its role as a major defense and aerospace contractor, with ongoing attention on how government and commercial demand may shape longer term prospects. For investors, this context helps frame whether the past 1 year return of 72.9% appears aligned with fundamentals or reflects changing sentiment about the sector.
- Within our checklist driven valuation framework, L3Harris currently scores 2 out of 6 on undervaluation tests. Next, we look at how traditional valuation approaches assess the stock, followed by a more holistic way to think about what that score may mean for individual investors.
L3Harris Technologies scores just 2/6 on our valuation checks. See what other red flags we found in the full valuation breakdown.
Approach 1: L3Harris Technologies Discounted Cash Flow (DCF) Analysis
The Discounted Cash Flow, or DCF, model estimates what a business might be worth today by projecting its future cash flows and then discounting those back to a present value.
For L3Harris Technologies, the model used is a 2 Stage Free Cash Flow to Equity approach based on cash flow projections. The latest twelve month free cash flow is about $2.66b. Analyst-style projections and subsequent extrapolations in this model indicate free cash flow of $3.01b in 2026, $3.56b in 2030, and $4.22b in 2035. Simply Wall St uses analyst estimates where available, then extends those forecasts further out using its own assumptions.
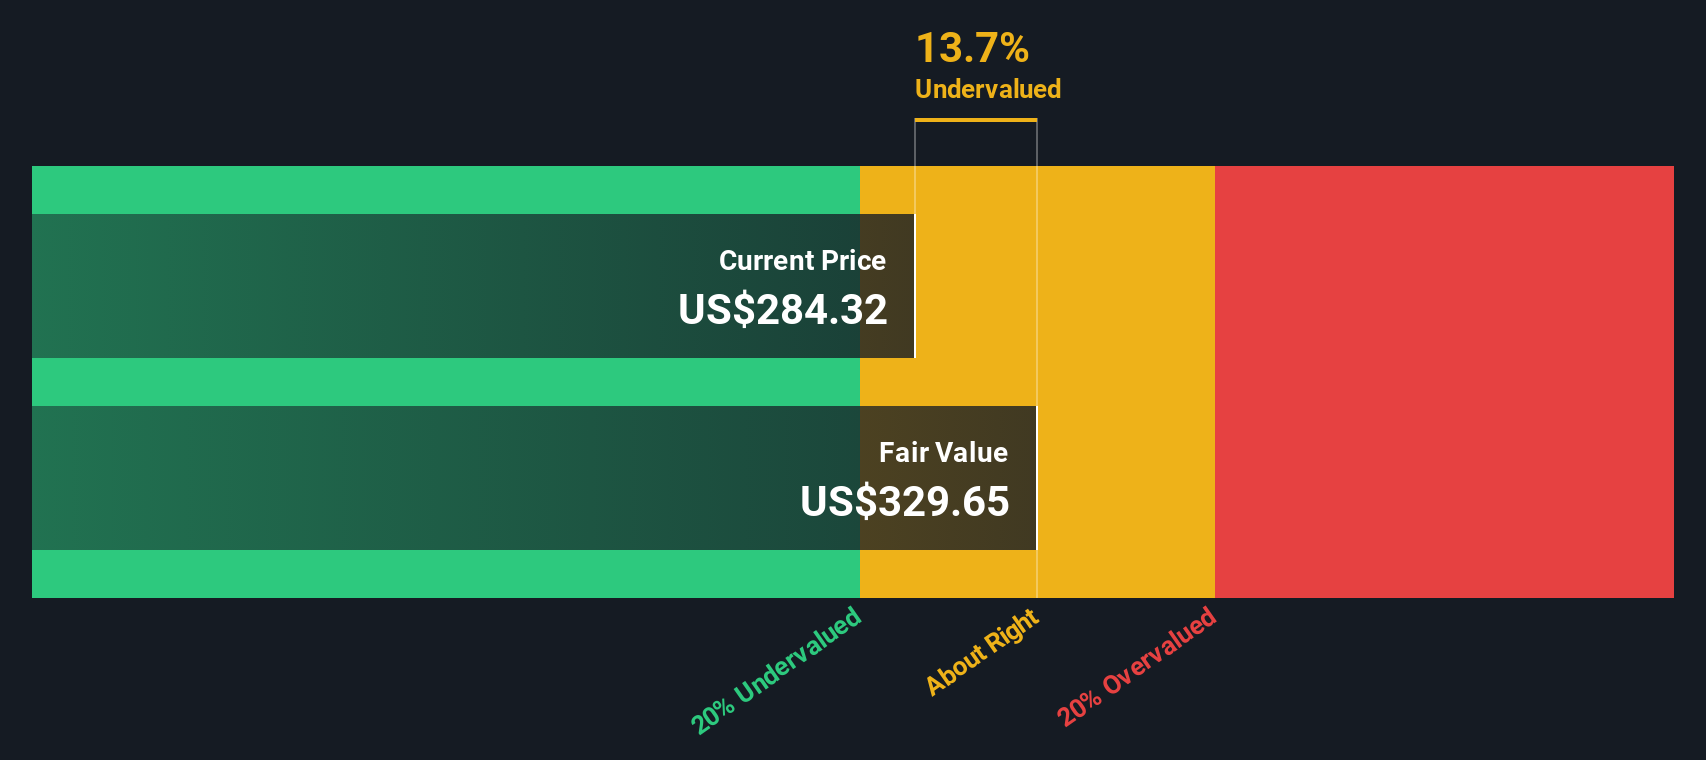
After discounting these projected cash flows back to today in $, the model arrives at an estimated intrinsic value of about $379.60 per share for NYSE:LHX. Compared with a share price around $340, this implies the stock is about 10.4% undervalued on this DCF view.
Result: UNDERVALUED
Our Discounted Cash Flow (DCF) analysis suggests L3Harris Technologies is undervalued by 10.4%. Track this in your watchlist or portfolio, or discover 51 more high quality undervalued stocks.
Approach 2: L3Harris Technologies Price vs Earnings
For a profitable business like L3Harris Technologies, the P/E ratio is a handy shorthand because it links what you pay per share to the earnings that each share currently generates. It is one way to sense check whether the market price feels high or low relative to the company’s earnings power.
What counts as a “normal” P/E often comes down to what investors expect for future earnings and how much risk they see in those earnings. Higher expected growth or lower perceived risk can support a higher multiple, while lower growth or higher risk usually points to a lower one.
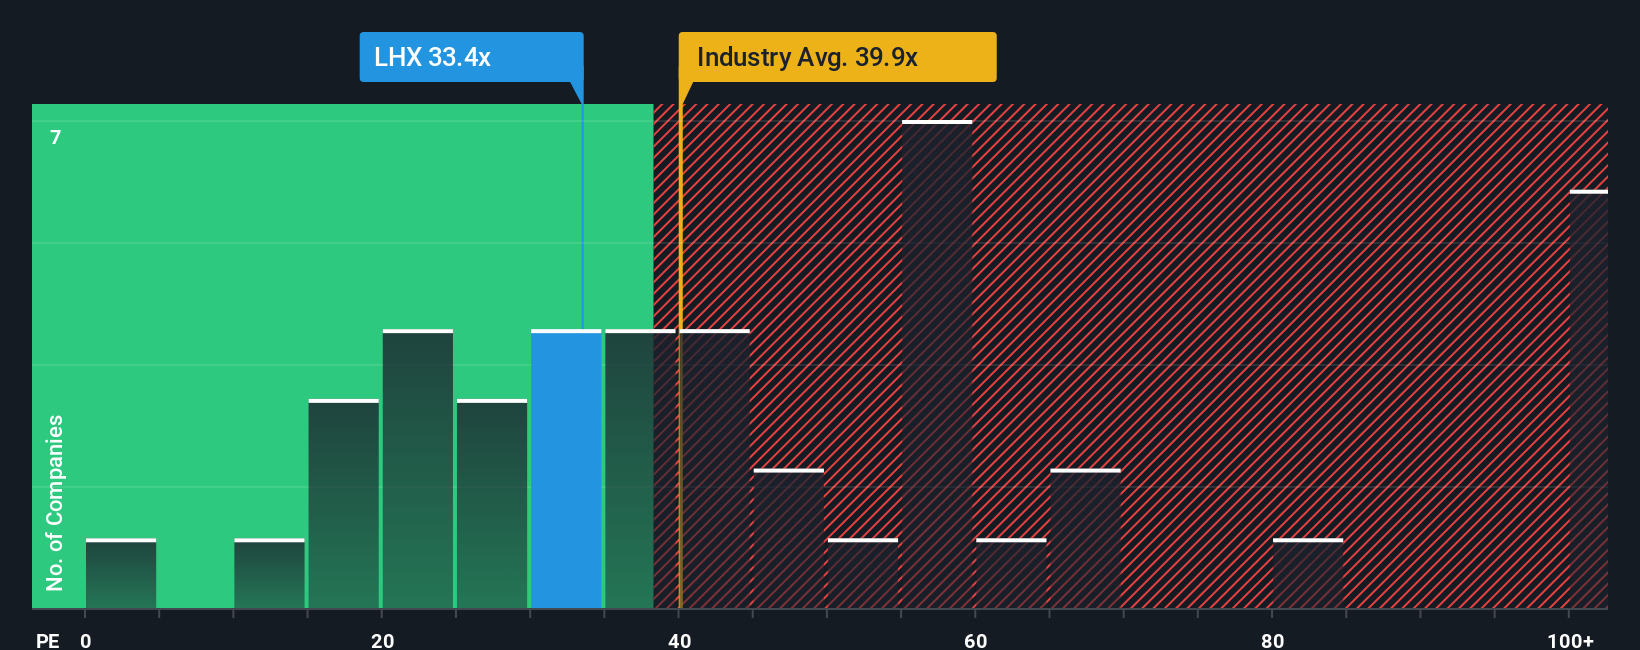
L3Harris trades on a P/E of 39.63x, compared with an Aerospace & Defense industry average of 41.95x and a peer group average of 37.69x. Simply Wall St’s Fair Ratio for L3Harris is 33.43x. This is its view of what the P/E might be given factors such as earnings growth, profit margins, industry, market cap and risk. This Fair Ratio can be more tailored than a simple peer or industry comparison because it tries to connect the valuation directly to the company’s own characteristics.
With the current P/E of 39.63x above the Fair Ratio of 33.43x, the stock screens as trading above that Fair Ratio view.
Result: OVERVALUED
P/E ratios tell one story, but what if the real opportunity lies elsewhere? Start investing in legacies, not executives. Discover our 22 top founder-led companies.
Upgrade Your Decision Making: Choose your L3Harris Technologies Narrative
Earlier we mentioned that there is an even better way to understand valuation. On Simply Wall St’s Community page you can use Narratives to set out your own story for L3Harris Technologies, link it to a forecast for revenue, earnings and margins, translate that into a Fair Value, and then compare it to the current price. Those Narratives update automatically as news and earnings arrive and reflect the full spread of opinions, from investors who see Fair Value closer to the lower analyst target of US$250 to others who anchor on the higher estimates around US$380.63 and beyond.
Do you think there's more to the story for L3Harris Technologies? Head over to our Community to see what others are saying!
This article by Simply Wall St is general in nature. We provide commentary based on historical data and analyst forecasts only using an unbiased methodology and our articles are not intended to be financial advice. It does not constitute a recommendation to buy or sell any stock, and does not take account of your objectives, or your financial situation. We aim to bring you long-term focused analysis driven by fundamental data. Note that our analysis may not factor in the latest price-sensitive company announcements or qualitative material. Simply Wall St has no position in any stocks mentioned.