Is It Too Late To Consider Taiwan Semiconductor Manufacturing (NYSE:TSM) After An 82% One Year Jump?
Taiwan Semiconductor Manufacturing Co., Ltd. Sponsored ADR TSM | 0.00 |
- If you are wondering whether Taiwan Semiconductor Manufacturing's current share price still makes sense for new money, you are not alone. A closer look at what you are paying for is the focus of this article.
- The stock recently closed at US$366.36, with returns of 3.1% over 7 days, 7.0% over 30 days, 14.6% year to date and 81.6% over 1 year, plus 321.8% over 3 years and 192.9% over 5 years.
- These moves have come as Taiwan Semiconductor Manufacturing continues to sit at the center of long term themes around advanced chip manufacturing and global supply chains, with investors closely watching its position in the semiconductor industry. Broader attention on chipmakers has also kept the stock firmly on many watchlists. This gives important context for assessing whether the current price still looks reasonable.
- On our simple valuation checklist, Taiwan Semiconductor Manufacturing scores 3 out of 6. Next we will look at how different valuation methods line up with that score, then finish with a more complete way to think about value than any single metric alone.
Approach 1: Taiwan Semiconductor Manufacturing Discounted Cash Flow (DCF) Analysis
A Discounted Cash Flow model takes estimates of the cash a company may generate in the future, then discounts those amounts back to today to arrive at an estimate of what the business could be worth per share right now.
For Taiwan Semiconductor Manufacturing, the model used here is a 2 Stage Free Cash Flow to Equity approach. The latest twelve month free cash flow is NT$900,193.91m, and analysts provide detailed projections for the next few years. Beyond that, Simply Wall St extrapolates cash flows out to 2035, with projected free cash flow in 2029 of NT$2,858,568.79m and a full set of discounted values for 10 years of forecasts.
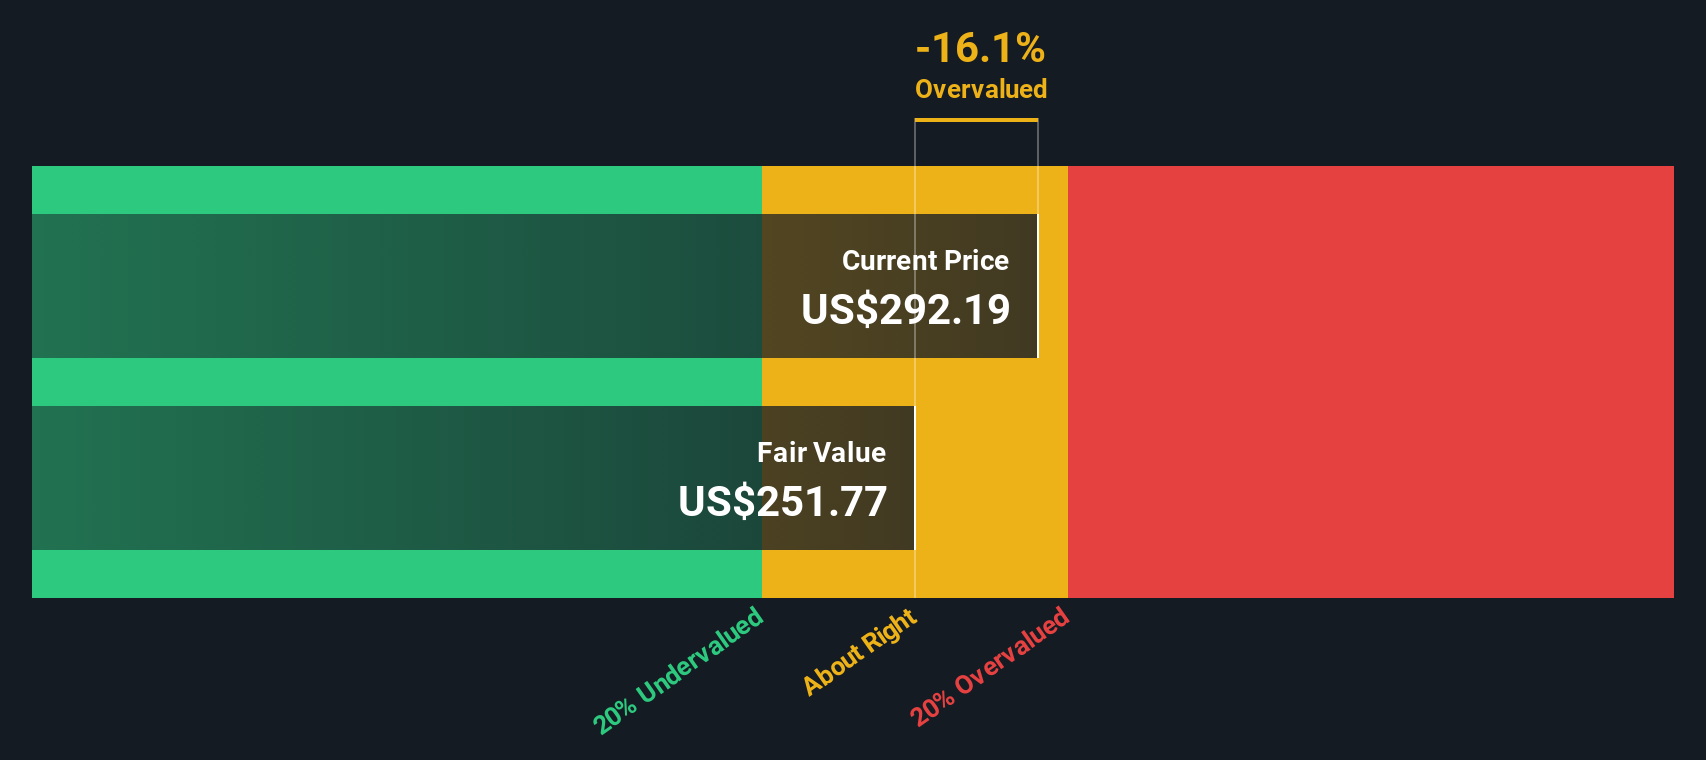
When those projected cash flows are discounted back and summed, the model arrives at an estimated intrinsic value of US$283.97 per share. Against the recent share price of US$366.36, this implies the stock trades at a 29.0% premium to the DCF estimate, which points to a rich valuation on this set of assumptions.
Result: OVERVALUED
Our Discounted Cash Flow (DCF) analysis suggests Taiwan Semiconductor Manufacturing may be overvalued by 29.0%. Discover 54 high quality undervalued stocks or create your own screener to find better value opportunities.
Approach 2: Taiwan Semiconductor Manufacturing Price vs Earnings
For a profitable company, the P/E ratio is a useful way to think about what you are paying for each dollar of earnings. It gives a quick sense of how the market weighs the company’s earnings profile relative to others.
In general, higher growth expectations or lower perceived risk can support a higher P/E, while lower growth or higher risk usually point to a lower “normal” P/E range. Context is important when you look at any single multiple.
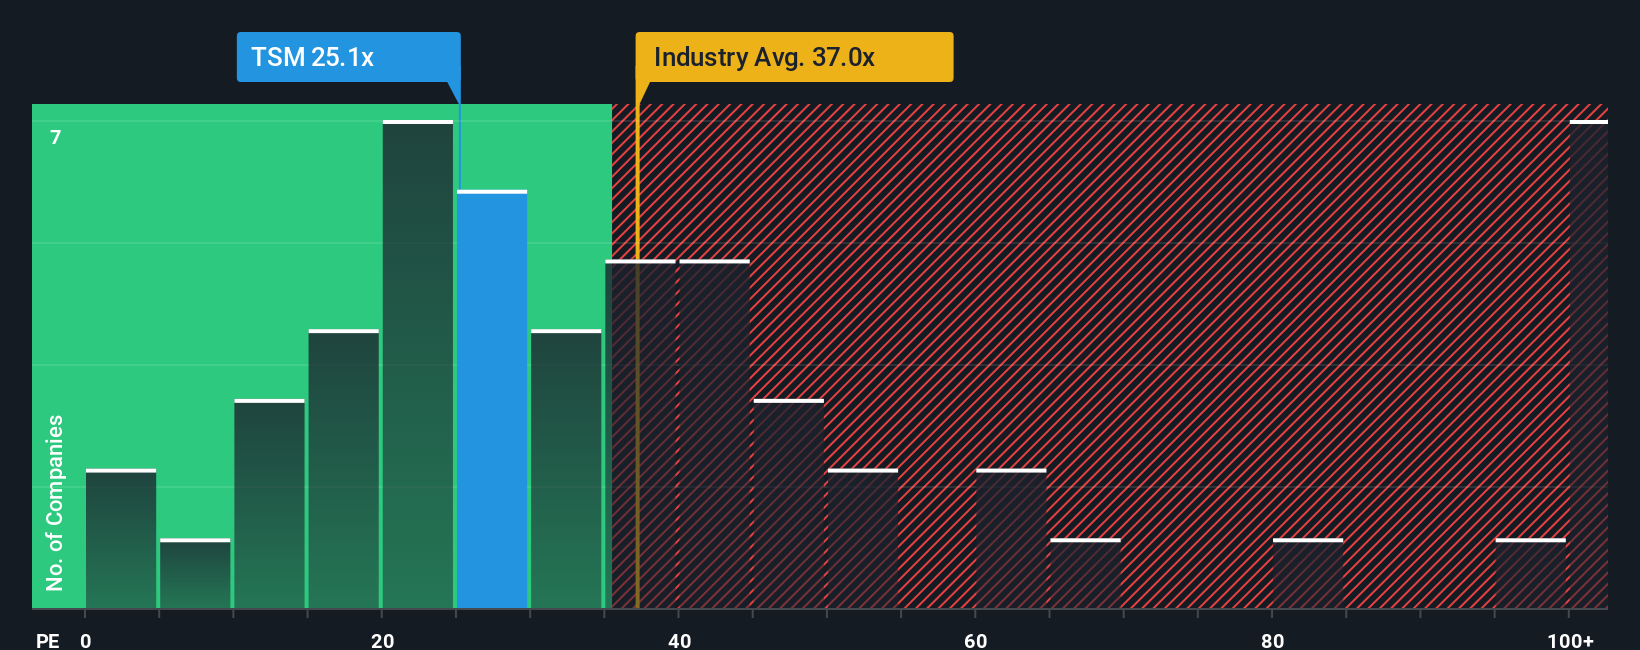
Taiwan Semiconductor Manufacturing currently trades on a P/E of 28.9x. That is below the Semiconductor industry average of 43.4x and the peer group average of 57.4x. On the surface, that suggests the stock is priced below many peers on an earnings basis.
Simply Wall St’s Fair Ratio for Taiwan Semiconductor Manufacturing is 41.4x. This is a proprietary estimate of what a more appropriate P/E might be, based on factors like earnings growth, profit margins, industry, market cap and company specific risks. Because it blends these elements into a single figure, it can be more tailored than a simple comparison with industry or peer averages.
Comparing the Fair Ratio of 41.4x with the actual P/E of 28.9x indicates that the stock screens as undervalued on this metric.
Result: UNDERVALUED
P/E ratios tell one story, but what if the real opportunity lies elsewhere? Start investing in legacies, not executives. Discover our 23 top founder-led companies.
Upgrade Your Decision Making: Choose your Taiwan Semiconductor Manufacturing Narrative
Earlier we mentioned that there is an even better way to understand valuation, so let us introduce you to Narratives, which are simply your own story about a company, linked directly to a forecast for revenue, earnings and margins, and then to an assumed fair value that you can compare with today’s price.
On Simply Wall St’s Community page, Narratives let you set out your view in plain language, then connect it to numbers, so instead of only looking at a P/E or DCF, you can say why you think Taiwan Semiconductor Manufacturing might justify a fair value of US$55.12, US$118.40, US$400.00 or even US$798.09, and see how that compares with the recent price of US$366.36.
Because Narratives on the platform update as new information such as earnings, guidance or news is added, they provide a living framework to decide whether the gap between your Fair Value and the current Price suggests a time to add, trim or simply watch, based on your own assumptions rather than relying only on headline multiples.
For Taiwan Semiconductor Manufacturing, here are previews of two leading Taiwan Semiconductor Manufacturing narratives.
You can use these as starting points and then adjust the assumptions to match your own view on growth, margins and risk, rather than relying on a single fair value number.
Fair value in this bull case narrative: US$400.00 per share
Gap to that fair value versus the recent US$366.36 price: about 8.4% below the narrative fair value
Revenue growth assumption used in this narrative: 76.64%
- Sees TSMC as the central infrastructure provider for AI and high performance computing, with a large share of global advanced chip production for customers such as Apple, Nvidia and other hyperscalers.
- Highlights recent quarterly results that include high revenue, strong net income and margins, supported by demand for 3 nm and other advanced nodes.
- Assumes continued expansion of fabs in Taiwan, the U.S., Japan and Europe, ongoing high margins and balance sheet strength, with geopolitical and concentration risks viewed as manageable.
Fair value in this more cautious narrative: US$118.40 per share
Gap to that fair value versus the recent US$366.36 price: about 209.3% above the narrative fair value
Revenue growth assumption used in this narrative: 23.21%
- Focuses on long term risks around China Taiwan relations, exposure to a small number of key customers and reliance on a limited number of advanced equipment suppliers such as ASML.
- Assumes revenue growth around 10% a year with a 40% net margin and uses a 20x future P/E to arrive at a fair value that is well below the recent share price.
- Views the current price as rich relative to these assumptions, even though it acknowledges TSMC's strong balance sheet, long dividend record and role in the chip sector.
Together, these two narratives show how different assumptions on growth, margins, risk and required return can lead to very different views on fair value for the same stock, even when both start from the same publicly available data.
If you want to see more viewpoints and build your own, have a look at the full range of community narratives and tweak the numbers so they line up with your expectations for Taiwan Semiconductor Manufacturing.
Do you think there's more to the story for Taiwan Semiconductor Manufacturing? Head over to our Community to see what others are saying!
This article by Simply Wall St is general in nature. We provide commentary based on historical data and analyst forecasts only using an unbiased methodology and our articles are not intended to be financial advice. It does not constitute a recommendation to buy or sell any stock, and does not take account of your objectives, or your financial situation. We aim to bring you long-term focused analysis driven by fundamental data. Note that our analysis may not factor in the latest price-sensitive company announcements or qualitative material. Simply Wall St has no position in any stocks mentioned.