

Is It Too Late To Consider Wells Fargo (WFC) After A 20% Year To Date Decline?
Wells Fargo & Company WFC | 0.00 |
- Wondering if Wells Fargo at around US$76 per share still offers value, or if most of the opportunity has already been priced in? This article breaks that question down using several valuation tools.
- The stock is close to its recent last close of US$76.11, with a modest 0.4% gain over the past week but a decline of 5.5% over the past month and a larger fall of 20.1% year to date, set against a 5.5% return over the last year and 106.0% over three years.
- Recent coverage has focused on Wells Fargo's role as a major US bank and ongoing discussions around the broader sector, including regulation, interest rate expectations, and credit conditions. This backdrop helps frame why the stock can move in ways that are not always in line with short term earnings headlines or single data points.
- Right now Wells Fargo scores a 6 out of 6 valuation check score. This raises a clear question about what different valuation approaches are seeing in the stock and whether there is an even better way to think about value that will be unpacked by the end of this article.
Approach 1: Wells Fargo Excess Returns Analysis
The Excess Returns model looks at how much value Wells Fargo creates above the minimum return that equity investors require, and then capitalizes those excess profits into an intrinsic value per share.
For Wells Fargo, the model starts with a Book Value of US$53.21 per share and a Stable EPS of US$7.98 per share, based on weighted future Return on Equity estimates from 17 analysts. The Average Return on Equity is 13.35%, while the Cost of Equity is US$4.82 per share. The difference between what the equity is expected to earn and what investors require is the Excess Return, which is US$3.16 per share.
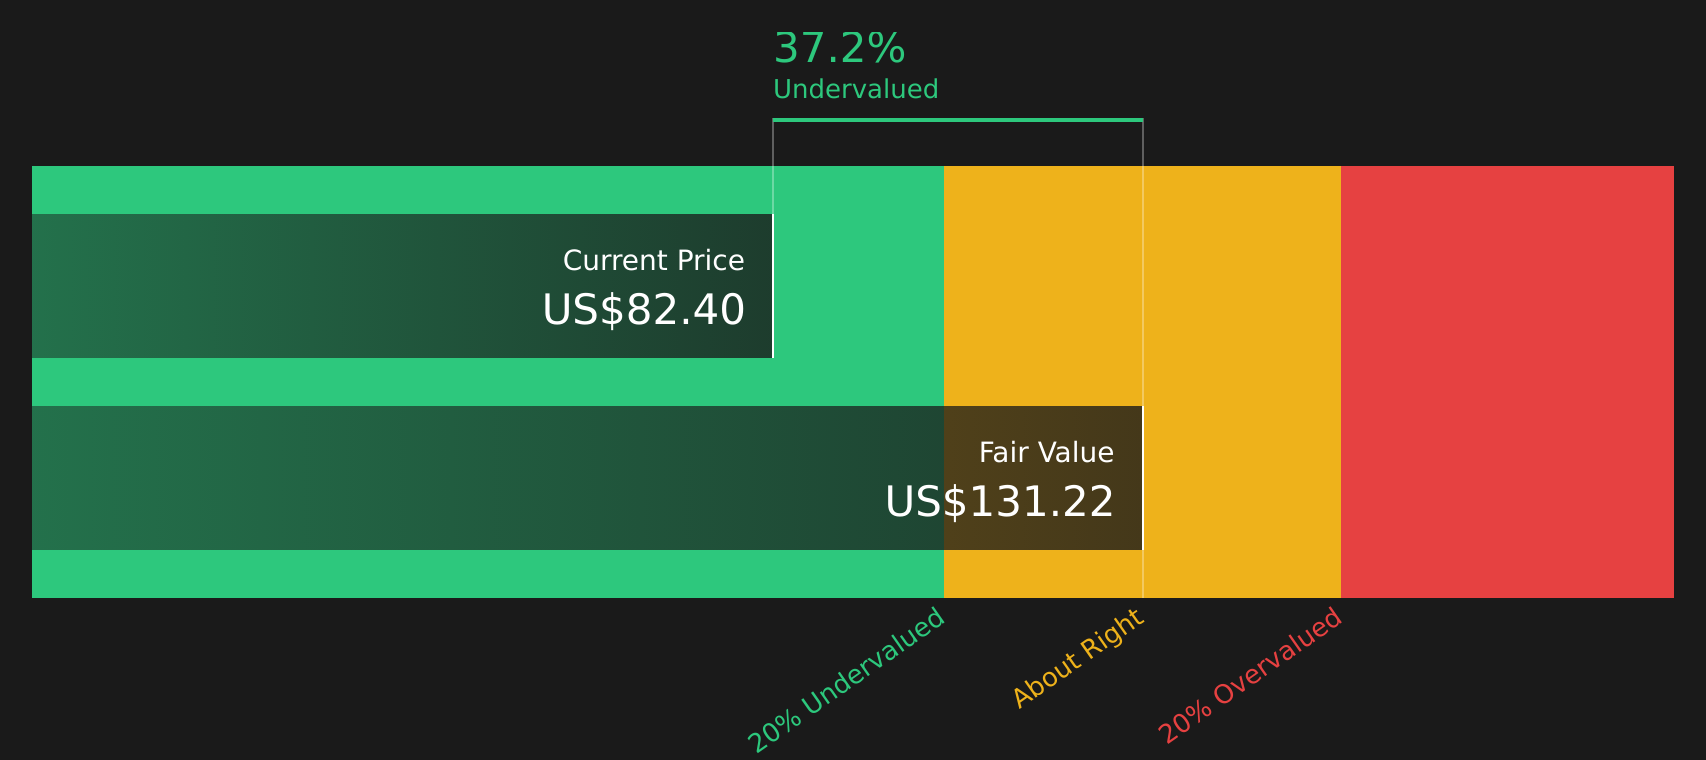
The model then applies these excess returns to a Stable Book Value of US$59.79 per share, sourced from weighted future Book Value estimates from 14 analysts, to arrive at an estimated intrinsic value of about US$129.59 per share. Compared with a share price around US$76, this implies the stock is about 41.3% undervalued according to this framework.
Result: UNDERVALUED
Our Excess Returns analysis suggests Wells Fargo is undervalued by 41.3%. Track this in your watchlist or portfolio, or discover 46 more high quality undervalued stocks.
Approach 2: Wells Fargo Price vs Earnings
The P/E ratio is a common way to value profitable companies because it directly links what you pay for the stock to the earnings it generates. In general, higher growth expectations and lower perceived risk tend to support a higher P/E, while lower growth or higher risk usually align with a lower, more conservative multiple.
Wells Fargo currently trades on a P/E of 11.27x. This sits close to the Banks industry average P/E of 11.50x and below the peer group average of 12.73x, so on simple comparisons the stock is not priced at a premium to its sector. However, these basic benchmarks do not fully reflect company specific factors such as earnings growth profile, market cap, profitability and risk.
Simply Wall St's Fair Ratio for Wells Fargo is 14.39x. This proprietary metric is designed to estimate what a more tailored P/E could look like once factors such as the company’s earnings growth, industry, profit margin, market cap and risk profile are taken into account, rather than relying only on broad peer or industry averages.
Comparing the current P/E of 11.27x with the Fair Ratio of 14.39x suggests Wells Fargo trades below this tailored reference point.
Result: UNDERVALUED

P/E ratios tell one story, but what if the real opportunity lies elsewhere? Start investing in legacies, not executives. Discover our 20 top founder-led companies.
Upgrade Your Decision Making: Choose your Wells Fargo Narrative
Earlier it was mentioned that there is an even better way to understand valuation. Narratives on Simply Wall St let you attach a clear story to your numbers by linking your view of Wells Fargo's future revenue, earnings and margins to a financial forecast. This turns that into a Fair Value that you can compare with the current share price to help inform your decision, all within an accessible Community page where millions of investors share views that update as new earnings or news arrive. One investor might build a Wells Fargo Narrative around a Fair Value of about US$74.70 with more modest revenue growth and a 28.0% profit margin. Another might focus on a Fair Value around US$96.63 with 6.82% revenue growth and a 24.41% margin. This shows how different perspectives on the same company translate directly into different fair values and decision points.
For Wells Fargo, however, we’ll make it really easy for you with previews of two leading Wells Fargo Narratives:
Fair Value: US$96.63
Implied undervaluation vs last close: about 21.2%
Revenue growth assumption: 6.82%
- Focuses on the impact of lifted regulatory constraints, with analysts expecting Wells Fargo to use its balance sheet more fully across deposits, lending, and wealth management.
- Builds on assumptions of 6.82% annual revenue growth, profit margins of about 24.4%, and a future P/E of roughly 13.1x by 2029, discounted at 8.65%.
- Highlights both support from digital banking and wealth management initiatives and risks around competition, regulation, customer behavior, and interest rate uncertainty, all feeding into a US$96.63 fair value anchor.
Fair Value: US$74.70
Implied overvaluation vs last close: about 1.9%
Revenue growth assumption: 3.0%
- Frames Wells Fargo as modestly ahead of its US$74.70 fair value, even though it points to a relatively low forward P/E compared with the broader market.
- Assumes around 3.0% revenue growth, a 28.0% profit margin, and a future P/E of 10.0x, all discounted at 6.0%, which together keep the narrative fair value close to but below the recent share price.
- Attributes the valuation stance partly to macro pressures on housing and manufacturing, even while acknowledging Wells Fargo’s scale, customer base, funding cost advantages, and potential regulatory changes as supportive factors.
These two narratives show how different assumptions about growth, margins, risk, and the appropriate P/E can lead to fair values that either sit well above or slightly below the current US$76.11 share price. The key for you as an investor is to decide which story lines up best with your own view of Wells Fargo’s earnings path, regulatory backdrop, and long term role in the US banking sector, then use that to frame whether today’s price feels attractive, full, or somewhere in between.
To see how these results tie into long-term growth, risks, and valuation, check out the full range of community narratives for Wells Fargo on Simply Wall St. Add the company to your watchlist or portfolio so you'll be alerted when the story evolves.
Do you think there's more to the story for Wells Fargo? Head over to our Community to see what others are saying!

This article by Simply Wall St is general in nature. We provide commentary based on historical data and analyst forecasts only using an unbiased methodology and our articles are not intended to be financial advice. It does not constitute a recommendation to buy or sell any stock, and does not take account of your objectives, or your financial situation. We aim to bring you long-term focused analysis driven by fundamental data. Note that our analysis may not factor in the latest price-sensitive company announcements or qualitative material. Simply Wall St has no position in any stocks mentioned.