Is It Too Late To Reassess Carvana (CVNA) After Its Sharp Multi Year Rally?
Carvana CVNA | 0.00 |
- If you are wondering whether Carvana's current share price lines up with its underlying value, this breakdown will help you connect the recent moves in the stock to what the numbers actually say.
- Carvana recently closed at US$382.60, with returns of 21.9% over 30 days, a 6.5% decline over 7 days, a 4.4% decline year to date, and a 48.8% return over 1 year. The 3 year return is very large.
- Recent news coverage has focused on Carvana's position in online used car retailing and the market's shifting expectations around growth, profitability and balance sheet strength. This context has helped shape how investors interpret the sharp multi year move in the share price and the more recent swings over shorter time frames.
- Simply Wall St currently assigns Carvana a valuation score of 1 out of 6. The sections that follow will walk through the different valuation approaches behind that result and then finish with a practical framework that can help you make more sense of these signals.
Carvana scores just 1/6 on our valuation checks. See what other red flags we found in the full valuation breakdown.
Approach 1: Carvana Discounted Cash Flow (DCF) Analysis
A Discounted Cash Flow, or DCF, model estimates what a business could be worth by projecting its future cash flows and then discounting those back to today using a required rate of return. It is essentially asking what a stream of future cash in your pocket is worth right now.
For Carvana, the model used is a 2 Stage Free Cash Flow to Equity approach. The latest twelve month free cash flow is about $751.6 million. Analysts provide explicit forecasts for the earlier years, then Simply Wall St extrapolates further out. By 2028, projected free cash flow is $1,650.97 million, with ten year projections rising gradually through 2035 based on those earlier analyst inputs and modest growth assumptions.
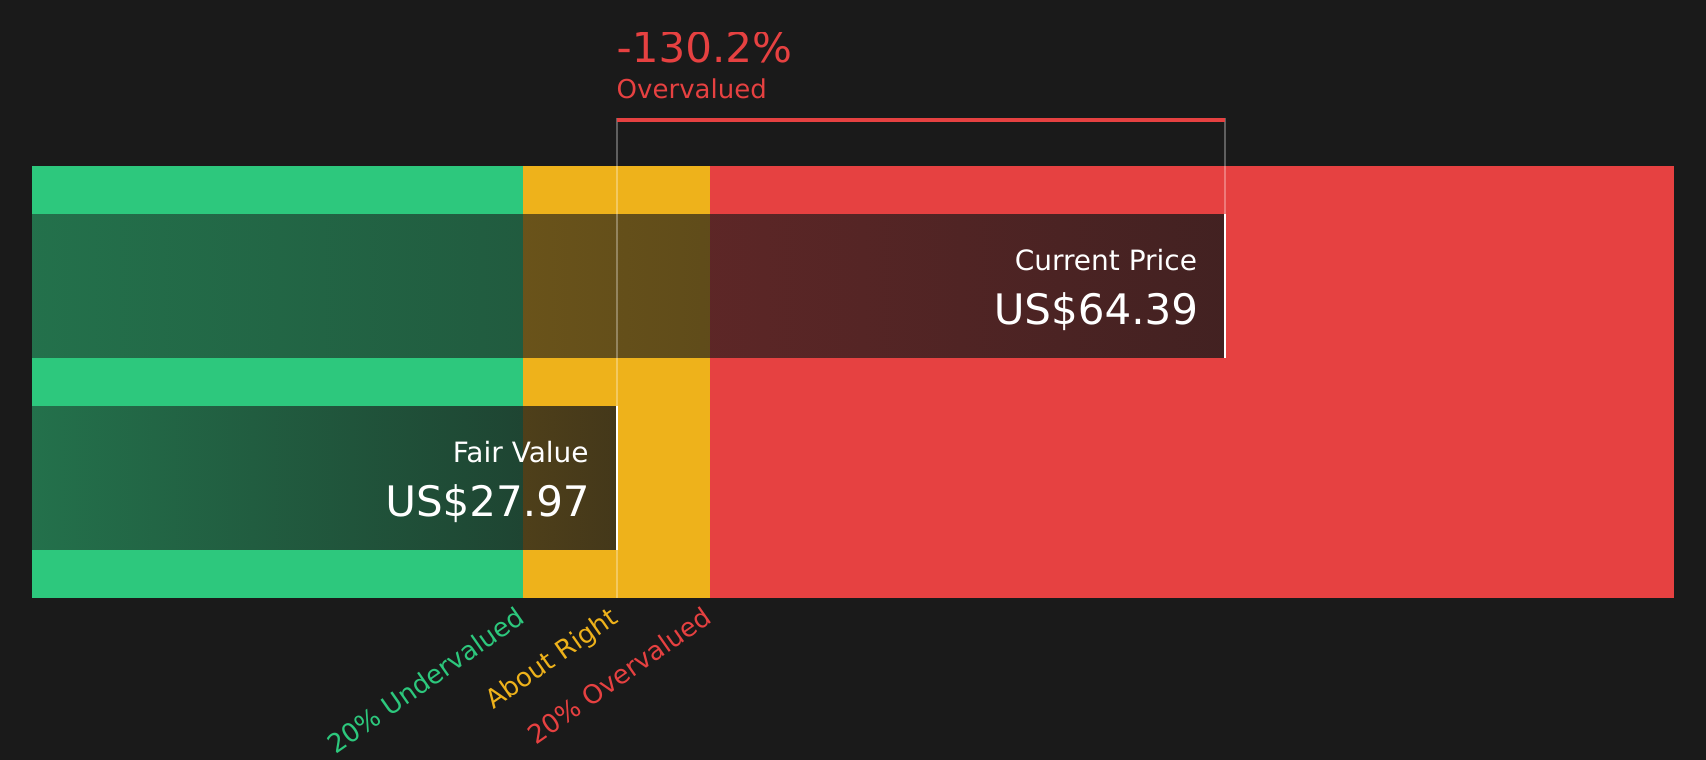
When all those projected cash flows are discounted back to today, the DCF points to an estimated intrinsic value of about $131.74 per share. Compared with the recent share price of US$382.60, this implies Carvana is 190.4% overvalued on this model.
Result: OVERVALUED
Our Discounted Cash Flow (DCF) analysis suggests Carvana may be overvalued by 190.4%. Discover 51 high quality undervalued stocks or create your own screener to find better value opportunities.
Approach 2: Carvana Price vs Earnings
For a business that is generating earnings, the P/E ratio is a straightforward way to connect the share price to the profits that support it. You are essentially asking how many dollars investors are currently willing to pay for each dollar of earnings.
What counts as a "fair" P/E depends on what the market expects for future growth and how risky those earnings appear. Higher expected growth or lower perceived risk can justify a higher P/E, while weaker outlooks or higher uncertainty usually support a lower P/E.
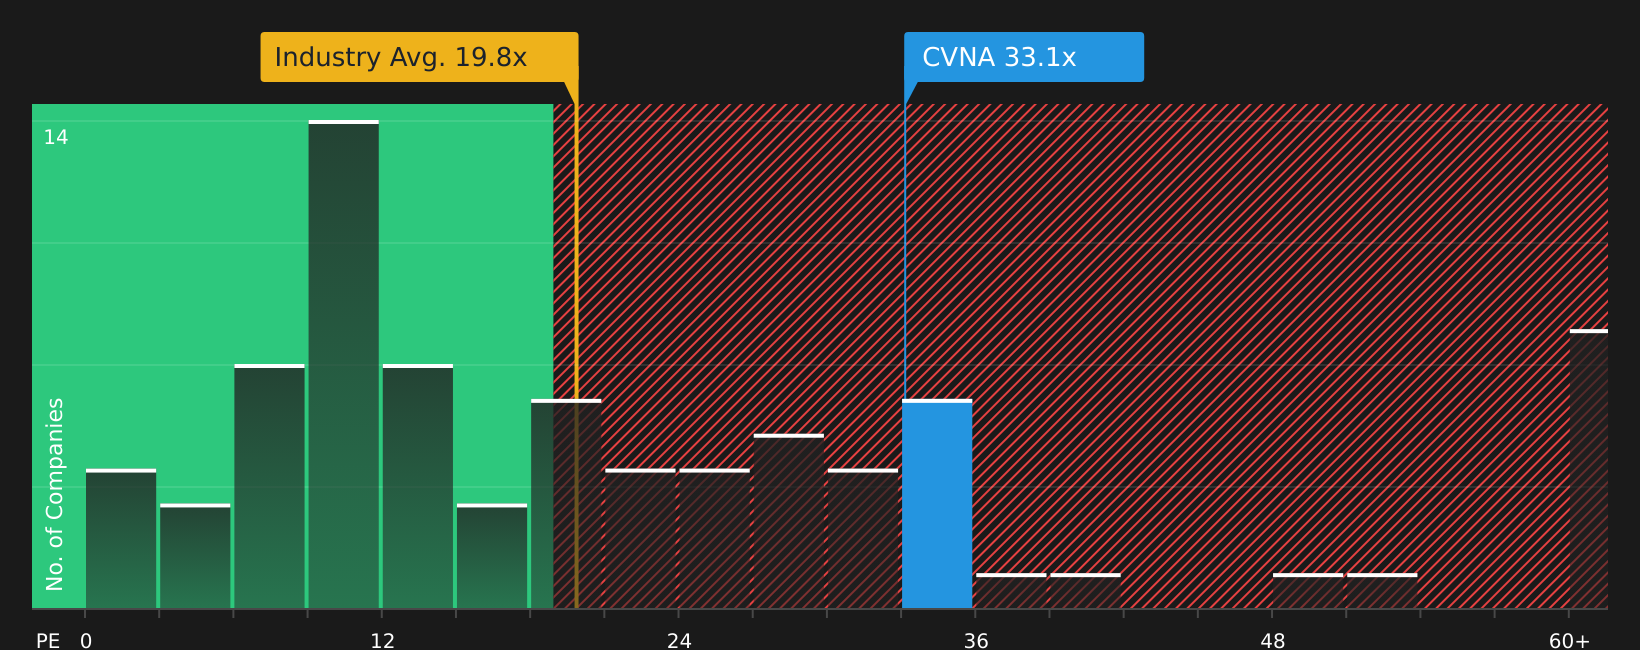
Carvana currently trades on a P/E of 38.04x. This sits well above the Specialty Retail industry average P/E of roughly 19.88x and also above the peer group average of 19.17x. To refine this comparison, Simply Wall St uses a proprietary "Fair Ratio" for Carvana of 30.76x, which reflects factors such as its earnings growth profile, profit margins, industry, market cap and specific risks.
This Fair Ratio is more tailored than a simple peer or industry comparison because it adjusts for the company’s own characteristics rather than assuming all retailers deserve the same multiple. With the current P/E of 38.04x versus a Fair Ratio of 30.76x, Carvana screens as expensive on this metric.
Result: OVERVALUED
P/E ratios tell one story, but what if the real opportunity lies elsewhere? Start investing in legacies, not executives. Discover our 17 top founder-led companies.
Upgrade Your Decision Making: Choose your Carvana Narrative
Earlier it was mentioned that there is an even better way to understand valuation. Narratives are introduced as a simple way for you to attach a clear story about Carvana to the numbers you care about, link that story to a revenue, earnings and margin forecast, and then see the fair value that falls out of those assumptions.
On Simply Wall St, Narratives sit inside the Community page and are used by millions of investors, giving you an accessible tool where you can compare Fair Value to the current price to help decide whether a stock looks attractive or stretched according to the story you find most reasonable.
Narratives also update when new information arrives, so if fresh Carvana news, short seller reports, SEC developments or new analyst forecasts change the outlook, the connected forecasts and Fair Values can be refreshed without you rebuilding everything from scratch.
For Carvana, one investor Narrative on the cautious end currently embeds a Fair Value of about US$0 per share with revenue contracting and a profit margin near 3.44%. A more optimistic Narrative assumes revenue growth of roughly 33.71%, profit margins near 8.10% and a Fair Value around US$519. Your task is to decide which story, or something in between, best matches what you believe.
For Carvana however we will make it really easy for you with previews of two leading Carvana Narratives:
Each one blends the valuation work you have seen with a fuller story about growth, margins, risks and balance sheet strength, so you can decide which version of the future feels closer to your own view of the stock.
Fair value in this bullish Narrative: US$519.00 per share.
Gap to that fair value versus the last close of US$382.60: about 26% below the Narrative fair value.
Revenue growth assumption: 33.71% a year.
- Backs Carvana to scale its vertically integrated model, with ADESA and nationwide reconditioning supporting higher unit volumes and potential operating leverage over time.
- Assumes revenue growth around 33.7% a year, profit margins rising from 6.9% to 8.1%, and earnings reaching about US$3.9b by 2029, with a future P/E of 28.4x.
- Flags meaningful risks around debt levels, competition, regulation and used vehicle demand, and encourages you to sense check these inputs against your own expectations.
Fair value in this cautious Narrative: US$0.00 per share.
Gap versus the last close of US$382.60: implies a very large downside versus this Narrative fair value.
Revenue growth assumption: 100% decline from current levels baked into the model.
- Highlights concerns about negative cash flow history, rapid debt expansion and the way revenue and earnings are recognised, including the possibility of accounting driven smoothing.
- Points to reliance on securitised subprime auto loans, potential issues around asset quality and the complexity of Carvana's capital structure when debt and cash reserves are considered together.
- References past regulatory actions and critical research reports, including Michigan license issues, fraud related allegations and an SEC subpoena, as reasons some investors assign no equity value in this scenario.
If you want to go beyond these previews and see how other investors are framing Carvana's upside and downside, you can review the full range of Community Narratives, compare the assumptions that sit behind each fair value, and then decide which story aligns best with your own risk tolerance and time horizon.
To see how these results tie into long-term growth, risks, and valuation, check out the full range of community narratives for Carvana on Simply Wall St. Add the company to your watchlist or portfolio so you'll be alerted when the story evolves.
Do you think there's more to the story for Carvana? Head over to our Community to see what others are saying!

This article by Simply Wall St is general in nature. We provide commentary based on historical data and analyst forecasts only using an unbiased methodology and our articles are not intended to be financial advice. It does not constitute a recommendation to buy or sell any stock, and does not take account of your objectives, or your financial situation. We aim to bring you long-term focused analysis driven by fundamental data. Note that our analysis may not factor in the latest price-sensitive company announcements or qualitative material. Simply Wall St has no position in any stocks mentioned.