Is NIKE (NKE) Now At An Attractive Price After Prolonged Share Price Weakness
NIKE, Inc. Class B NKE | 0.00 |
- Wondering whether NIKE at around US$44.14 is a bargain or a value trap? This article breaks down what the current price actually reflects.
- The stock has edged up 2.4% over the past week and 3.6% over the past month, yet is still down 30.2% year to date and 27.7% over the last year. Longer term 3 year and 5 year returns are also in decline at 61.0% and 65.1% respectively.
- Recent attention on NIKE has focused on how its share price performance compares with wider consumer durables stocks and what that means for expectations around its brand strength and long term positioning. Investors are also watching how the market weighs that history of price declines against any potential for sentiment to shift over time.
- Simply Wall St's valuation model currently gives NIKE a value score of 1 out of 6. Next up is a breakdown of the key valuation methods behind that figure and, at the end of the article, a look at a broader way to think about what the stock might be worth.
NIKE scores just 1/6 on our valuation checks. See what other red flags we found in the full valuation breakdown.
Approach 1: NIKE Discounted Cash Flow (DCF) Analysis
A Discounted Cash Flow, or DCF, model estimates what a stock could be worth by projecting future cash flows and then discounting them back to today using a required return. It is essentially asking what those future dollars are worth in today’s terms.
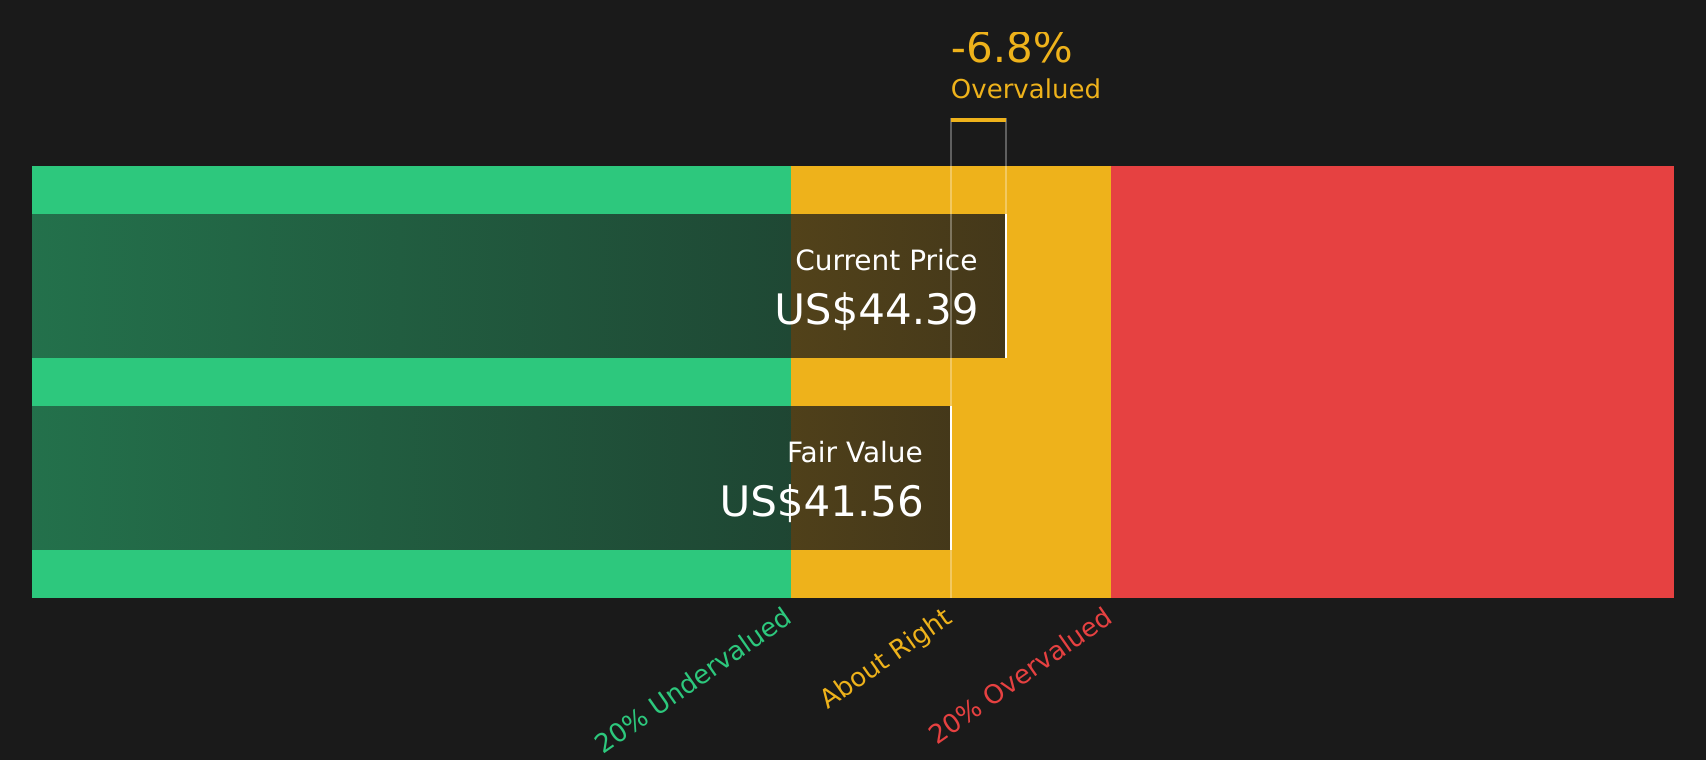
For NIKE, the model used is a 2 Stage Free Cash Flow to Equity approach. The latest twelve month free cash flow is about $1.04b. Analyst and extrapolated projections used by Simply Wall St run out to 2035, with free cash flow for 2030 projected at $3.91b and later years based on gradual extrapolation. All figures are in $ and already discounted where stated.
Bringing these projected cash flows back to today produces an estimated intrinsic value of $41.64 per share. Against the recent share price of about $44.14, the DCF suggests the stock is around 6.0% more expensive than this model’s estimate, which is a relatively small gap.
Result: ABOUT RIGHT
NIKE is fairly valued according to our Discounted Cash Flow (DCF), but this can change at a moment's notice. Track the value in your watchlist or portfolio and be alerted on when to act.
Approach 2: NIKE Price vs Earnings (P/E)
For profitable companies, the P/E ratio is a useful way to see how much investors are currently paying for each dollar of earnings. This is often how the market frames expectations around quality and staying power.
What counts as a “normal” P/E depends heavily on how fast earnings are expected to grow and how risky those earnings are. Higher growth and lower perceived risk tend to justify higher P/E multiples, while slower growth or higher uncertainty usually calls for lower ones.
NIKE currently trades on a P/E of about 29.1x, compared with a Luxury industry average of about 21.1x and a peer group average of roughly 28.4x. Simply Wall St also calculates a proprietary “Fair Ratio” for NIKE of 31.1x. This Fair Ratio is designed to be a more tailored reference point than simple peer or industry comparisons because it incorporates factors such as earnings growth, profit margins, the company’s size and key risks.
Putting that together, NIKE’s current P/E of 29.1x sits below the Fair Ratio of 31.1x. This points to the stock trading somewhat below what that model suggests could be reasonable.
Result: UNDERVALUED

P/E ratios tell one story, but what if the real opportunity lies elsewhere? Start investing in legacies, not executives. Discover our 19 top founder-led companies.
Upgrade Your Decision Making: Choose your NIKE Narrative
Earlier sections used DCFs and P/E ratios, but if you want a clearer way to connect the story you believe about NIKE with the numbers you see on screen, Narratives on Simply Wall St let you do exactly that. They turn your view of the company into a structured forecast and a Fair Value that updates as new news or earnings land. This allows you to constantly compare that Fair Value with the current price and decide whether the stock looks more attractive or less attractive against your own expectations, rather than just the market’s.
For NIKE however, we will make it really easy for you with previews of two leading NIKE Narratives:
Each one connects a different story about the business to a specific Fair Value, growth outlook and risk profile so you can see which version lines up more closely with your own expectations.
Fair Value: US$75.23
Price vs Fair Value: around 41% below this narrative Fair Value
Revenue growth assumption: 4%
- The narrative sees Direct To Consumer as a double edged sword, with better margins but a risk that easier online access also helps competitors chip away at NIKE's market share.
- Brand strength is viewed as important but not enough on its own to keep justifying a premium P/E if competition keeps scaling and consumers focus more on price and fewer pairs per year.
- Market share pressures, input costs, freight and inventory are all treated as manageable over time, with the view that NIKE can still earn solid margins even if the footwear market becomes more crowded.
Fair Value: US$43.01
Price vs Fair Value: around 3% above this narrative Fair Value
Revenue growth assumption: 10%
- The narrative emphasizes NIKE's global scale, brand reach and cost efficiency, but still concludes that the stock can trade above what cash flow based models and comparison multiples imply.
- There is a focus on broad affordability for middle and lower income consumers and the idea that this helps support demand across different economic backdrops.
- A stronger Direct To Consumer push and product development are seen as positives, yet the story still flags a gap between current pricing and the implied value from DCF and other valuation tools.
If you want to go beyond the previews and see how other investors are connecting these stories to NIKE's valuation, margins and long term options, the full set of Narratives on Simply Wall St gives you a wider range of assumptions and Fair Values to compare against the current price.
To see how these results tie into long-term growth, risks, and valuation, check out the full range of community narratives for NIKE on Simply Wall St. Add the company to your watchlist or portfolio so you'll be alerted when the story evolves.
Do you think there's more to the story for NIKE? Head over to our Community to see what others are saying!

This article by Simply Wall St is general in nature. We provide commentary based on historical data and analyst forecasts only using an unbiased methodology and our articles are not intended to be financial advice. It does not constitute a recommendation to buy or sell any stock, and does not take account of your objectives, or your financial situation. We aim to bring you long-term focused analysis driven by fundamental data. Note that our analysis may not factor in the latest price-sensitive company announcements or qualitative material. Simply Wall St has no position in any stocks mentioned.