

Is Nike (NKE) Worth A Fresh Look After This Week’s 6.7% Share Price Jump?
NIKE NKE | 0.00 |
- For investors considering whether NIKE at around US$44.67 represents value or added volatility, this article walks through key signals so you can evaluate the stock on its price tag rather than its brand.
- The stock has risen 6.7% over the past week, while year to date it is down 29.4% and over the past year it is down 23.7%. These moves may prompt investors to reassess both risk and potential upside.
- Recent headlines have focused on NIKE's position in the athleticwear market, including commentary on competition, consumer demand trends and its product pipeline. This context helps frame why the stock has seen a sharp weekly gain despite multi year declines of 56.0% over three years and 64.8% over five years.
- NIKE currently scores just 1 out of 6 on Simply Wall St's valuation checks. Next up is a closer look at how different valuation tools assess the stock today and how a more complete framework can give you a clearer view of what you are paying for.
NIKE scores just 1/6 on our valuation checks. See what other red flags we found in the full valuation breakdown.
Approach 1: NIKE Discounted Cash Flow (DCF) Analysis
A Discounted Cash Flow, or DCF, model estimates what a stock could be worth by projecting future cash flows and then discounting them back to today using a required return. It is essentially asking what all those future dollars are worth in current terms.
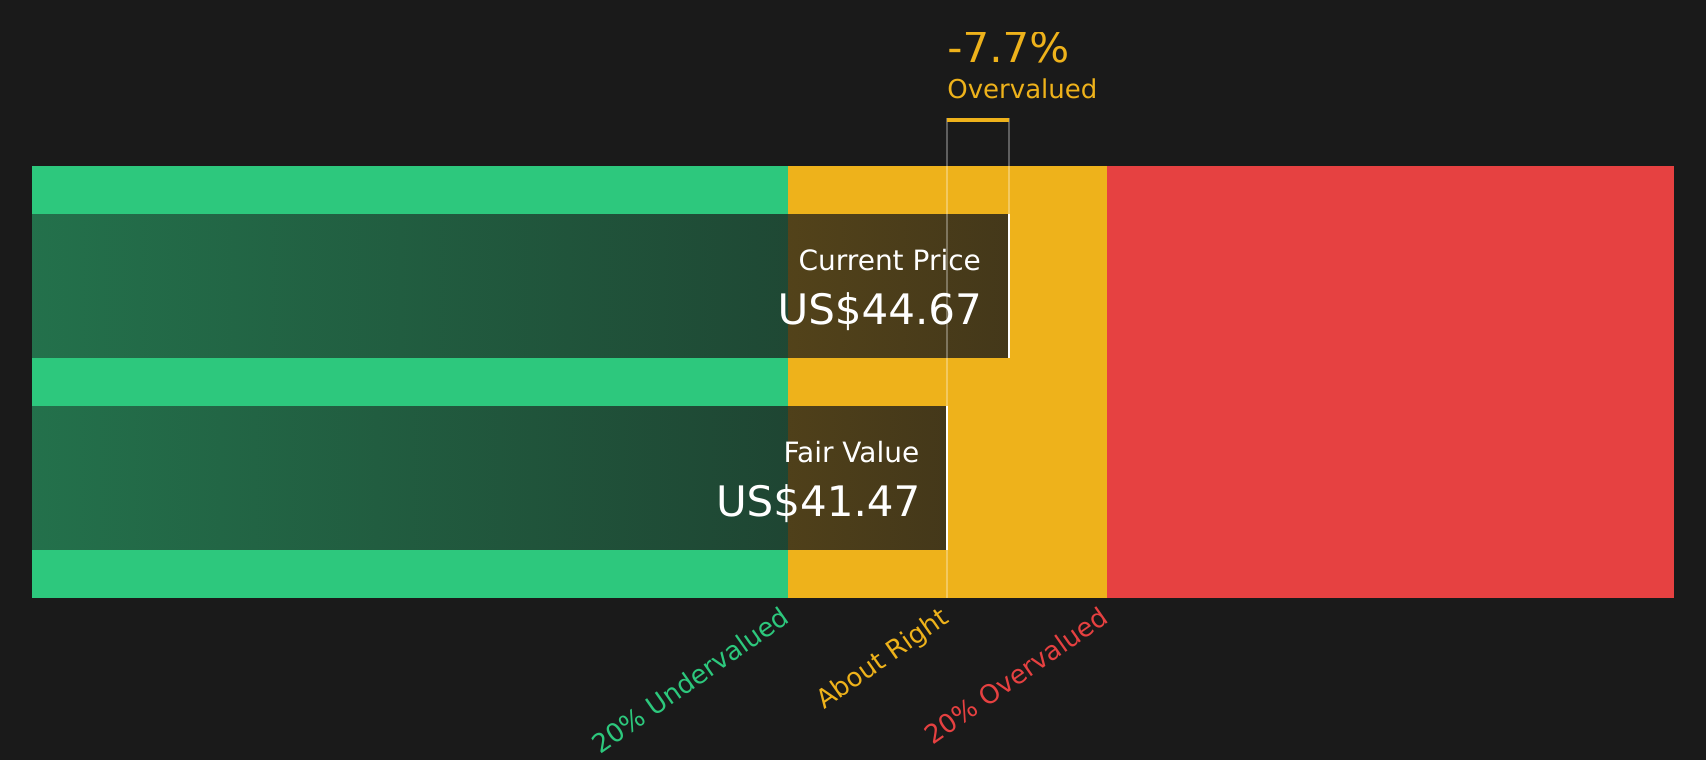
For NIKE, the Simply Wall St model uses a 2 Stage Free Cash Flow to Equity approach, starting from last twelve months free cash flow of about $1.04b. Analyst projections and subsequent extrapolations point to free cash flow of about $3.91b by 2030, with a detailed path of forecasts and estimated figures each year through 2035.
Pulling those cash flows together, the model arrives at an estimated intrinsic value of $41.46 per share. Compared with the recent share price of about $44.67, the DCF output suggests the stock is roughly 7.7% above this estimate, which sits in a fairly tight range rather than at an extreme.
Result: ABOUT RIGHT
NIKE is fairly valued according to our Discounted Cash Flow (DCF), but this can change at a moment's notice. Track the value in your watchlist or portfolio and be alerted on when to act.
Approach 2: NIKE Price vs Earnings
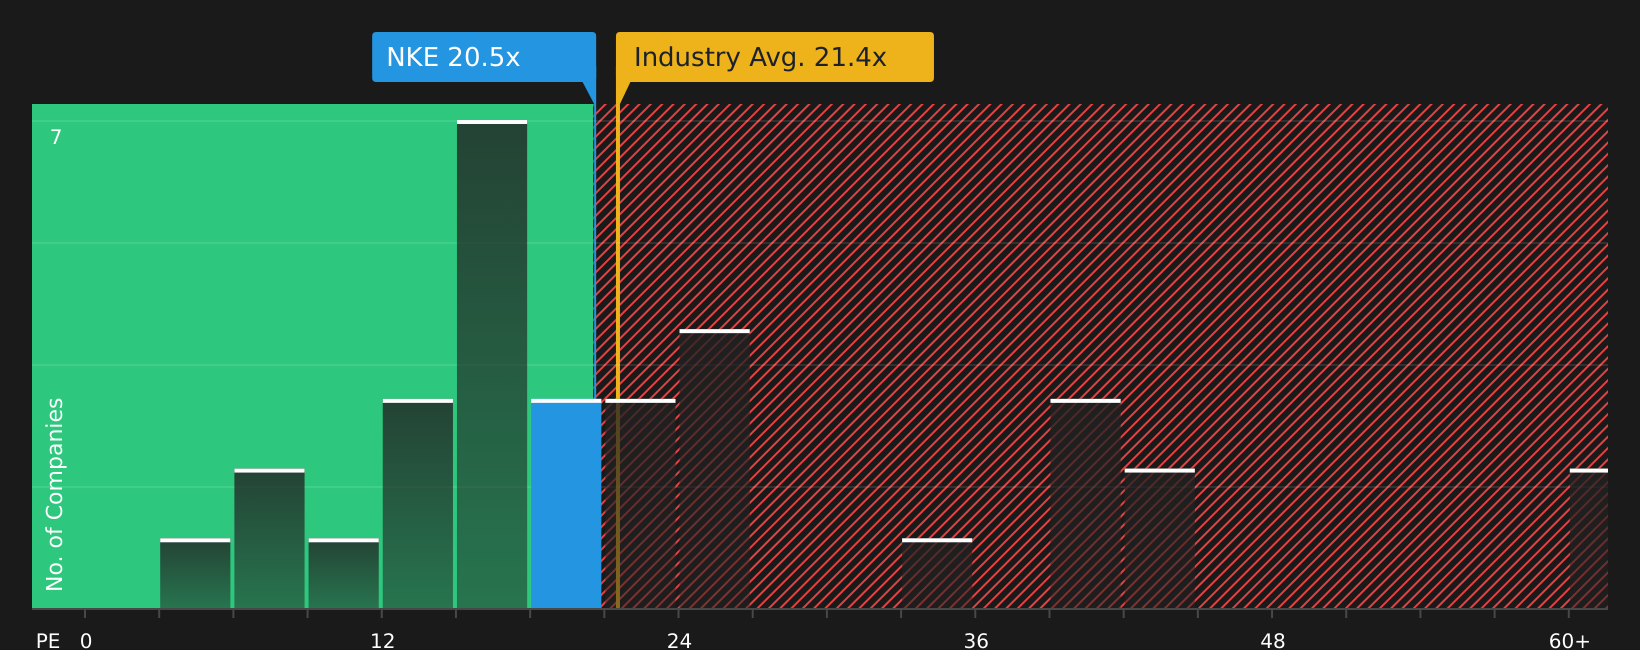
For a profitable company like NIKE, the P/E ratio is a useful way to relate what you pay for each share to the earnings that support it. It helps you see how many dollars of price the market is assigning to each dollar of current earnings.
What counts as a “normal” P/E depends on how the market views a company’s growth prospects and risk. Higher growth and lower perceived risk often justify a higher P/E, while slower growth or higher uncertainty usually line up with a lower multiple.
NIKE currently trades on a P/E of about 29.4x. That sits above the Luxury industry average of about 22.1x, and slightly above the peer average of about 28.6x. Simply Wall St’s Fair Ratio for NIKE is 31.2x. This Fair Ratio is a proprietary estimate of what NIKE’s P/E might be given its earnings growth profile, industry, profit margins, market cap and risk characteristics.
Because the Fair Ratio folds in company specific factors as well as industry and size, it can be more informative than a simple comparison with peers or sector averages. With NIKE’s current P/E of 29.4x sitting below the Fair Ratio of 31.2x, the stock screens as slightly undervalued on this metric.
Result: UNDERVALUED
P/E ratios tell one story, but what if the real opportunity lies elsewhere? Start investing in legacies, not executives. Discover our 20 top founder-led companies.
Upgrade Your Decision Making: Choose your NIKE Narrative
Earlier it was mentioned that there is an even better way to understand valuation. This is where Narratives come in, giving you a simple way to connect your view of NIKE’s story with hard numbers by linking your assumptions for fair value, revenue, earnings and margins to a forecast and then to a clear fair value that you can compare against the current price. All of this happens inside Simply Wall St’s Community page, where Narratives update automatically when fresh news or earnings arrive, and where different investors can set very different but transparent NIKE views. For example, one Narrative has a fair value of about US$25.51 based on flat revenue and modest margins, and another has a fair value near US$109.11 based on faster growth and higher profitability. This way you can quickly see which story feels closer to your own and decide how the stock fits your buy and sell plan.
For NIKE however we will make it really easy for you with previews of two leading NIKE Narratives:
Fair value: about US$75.23 per share
Current price vs fair value: the stock is around 40.6% below this narrative fair value
Revenue growth assumption: 4%
- The author expects direct to consumer growth to compress NIKE's market share as more competitors use the same channels.
- The narrative leans on NIKE's brand strength but questions whether product innovation and a premium P/E are justified in a crowded footwear market.
- The thesis assumes moderate revenue growth, stable margins and ongoing buybacks, while highlighting risks from competition, pricing pressure, FX, inflation and reputation.
Fair value: about US$43.01 per share
Current price vs fair value: the stock is around 3.9% above this narrative fair value
Revenue growth assumption: 10%
- This narrative highlights NIKE's global brand, large scale and cost efficiencies as key supports for its current position.
- The author focuses on NIKE's reach across income levels and argues that pricing and distribution help the company hold demand during weaker economic periods.
- Even with those positives, the narrative's latest update characterizes the stock as expensive relative to several valuation models and suggests patience around entry levels.
If you want to see the full range of viewpoints, including all 11 Narratives that rate NIKE as either undervalued or overvalued, the Community page lays them out side by side so you can decide which set of assumptions feels closest to your own plan.See what the community is saying about NIKE
Do you think there's more to the story for NIKE? Head over to our Community to see what others are saying!

This article by Simply Wall St is general in nature. We provide commentary based on historical data and analyst forecasts only using an unbiased methodology and our articles are not intended to be financial advice. It does not constitute a recommendation to buy or sell any stock, and does not take account of your objectives, or your financial situation. We aim to bring you long-term focused analysis driven by fundamental data. Note that our analysis may not factor in the latest price-sensitive company announcements or qualitative material. Simply Wall St has no position in any stocks mentioned.