Is Nutanix (NTNX) Priced Attractive After Recent Share Price Weakness
Nutanix NTNX | 36.83 | -1.26% |
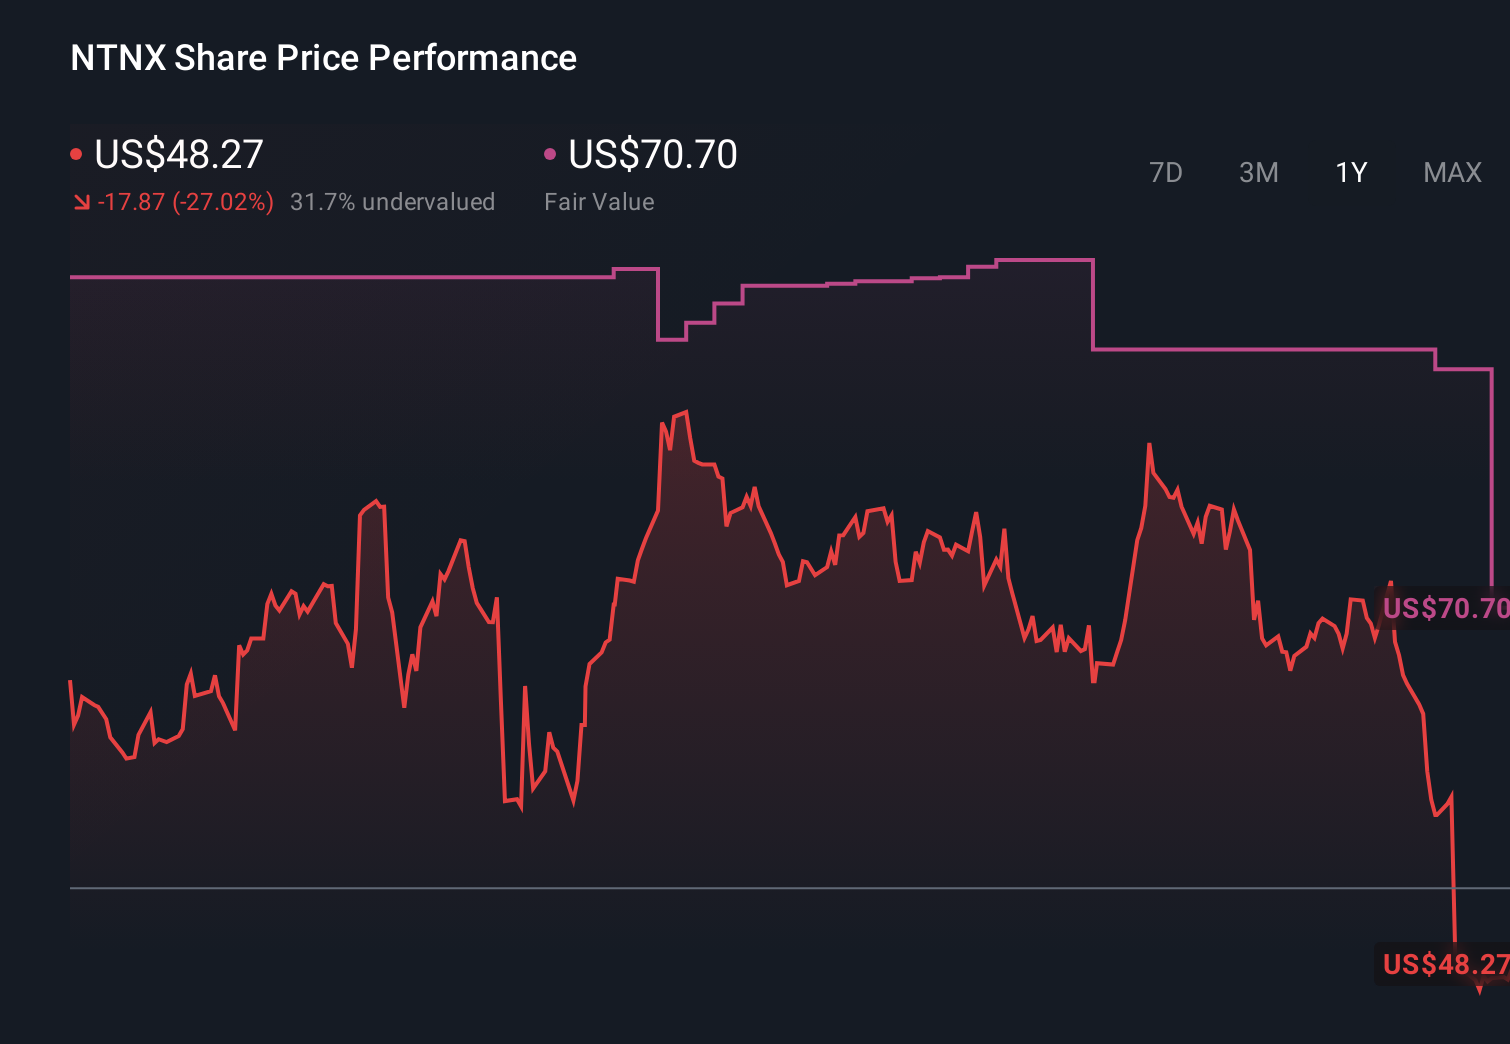
- If you are wondering whether Nutanix at around US$41.76 is a bargain or a value trap, you are not alone. This article is here to walk you through what the current price might be telling you.
- The stock has had a mixed run, with a 0.3% decline over the last week, an 8.7% decline over the past month, a 17.5% decline year to date, but returns of 50.1% over 3 years and 30.6% over 5 years that may still catch the eye of longer term investors.
- Recent coverage has focused on Nutanix as a key player in software infrastructure, including ongoing commentary about its position in cloud and hybrid IT as enterprises reassess their technology stacks. This context helps frame why the share price has seen shorter term weakness alongside still positive multi year returns, as investors weigh growth expectations against risk and competition.
- Right now Nutanix scores 3 out of 6 on our valuation checks, giving it a value score of 3. Next we will compare what different methods like DCF, multiples and peer comparisons suggest about that number, then finish with a framework that can help you read any valuation in a more complete way.
Approach 1: Nutanix Discounted Cash Flow (DCF) Analysis
A Discounted Cash Flow, or DCF, model takes Nutanix's expected future cash flows and discounts them back to today to estimate what the entire business might be worth right now.
For Nutanix, the model uses a 2 stage Free Cash Flow to Equity approach, starting with last twelve month free cash flow of about $773.8 million. Analyst style projections and extrapolations then extend that path out, with Simply Wall St's inputs pointing to free cash flow of around $1.62 billion in 2035, all in $ terms. Each of these future cash flows is discounted back to today and summed to arrive at an overall equity value.
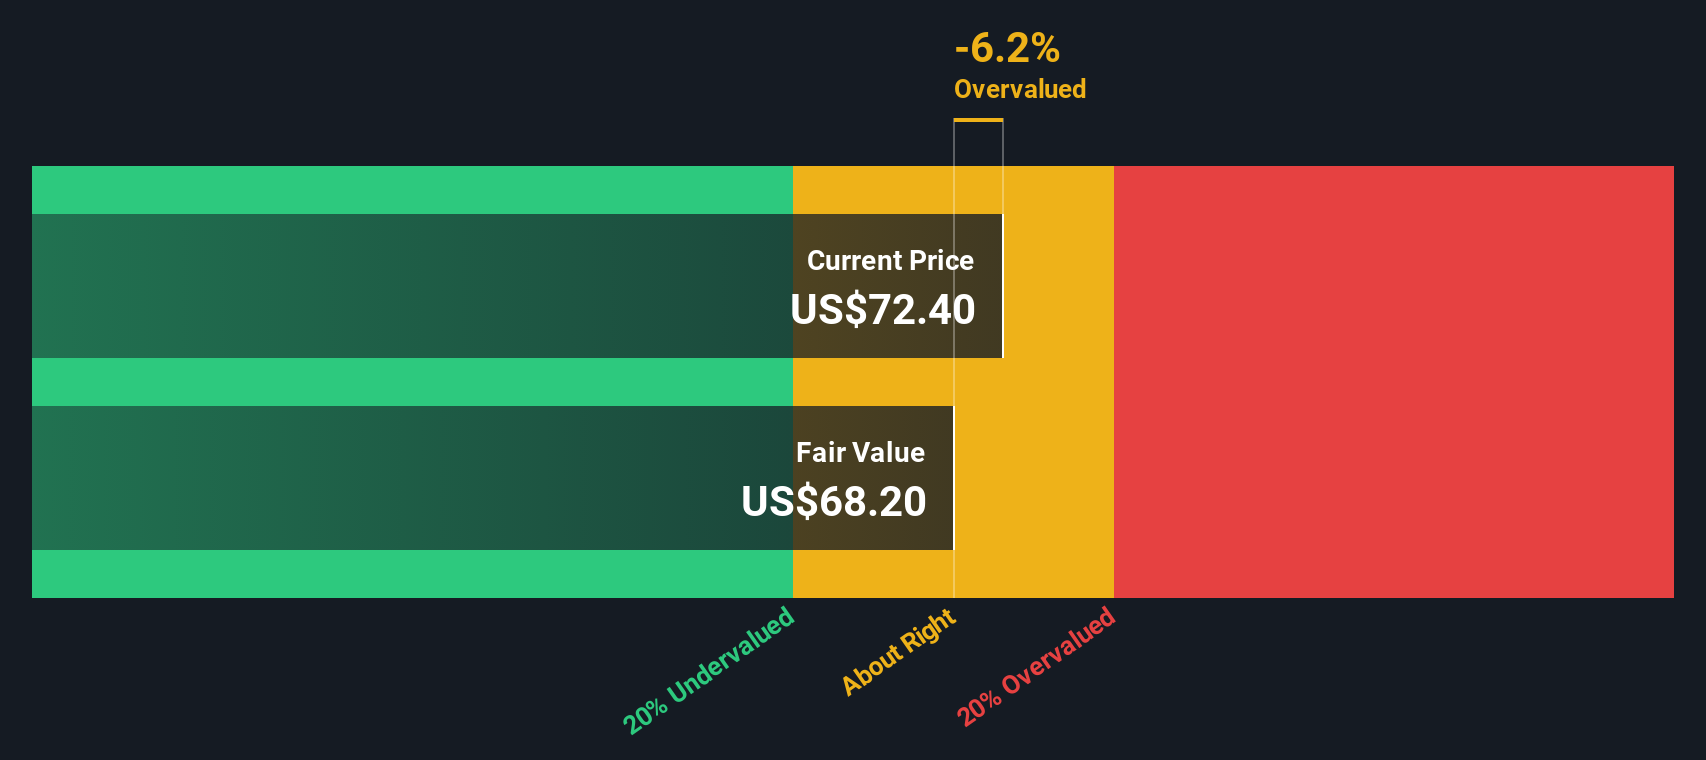
On this basis, the estimated intrinsic value works out to a DCF fair value of about $78.70 per share. Compared with the current share price of around $41.76, the model suggests Nutanix is trading at a 46.9% discount, which indicates the shares screen as materially undervalued using this method alone.
Result: UNDERVALUED
Our Discounted Cash Flow (DCF) analysis suggests Nutanix is undervalued by 46.9%. Track this in your watchlist or portfolio, or discover 55 more high quality undervalued stocks.
Approach 2: Nutanix Price vs Earnings
For a profitable company, the P/E ratio is a useful way to link what you pay for each share to the earnings that business is currently generating. It helps you see how many dollars of price the market is placing on each dollar of earnings.
What counts as a normal or fair P/E will usually shift with investors expectations for future growth and their view of risk. Higher expected growth or lower perceived risk can support a higher P/E, while lower growth or higher risk tends to justify a lower P/E.
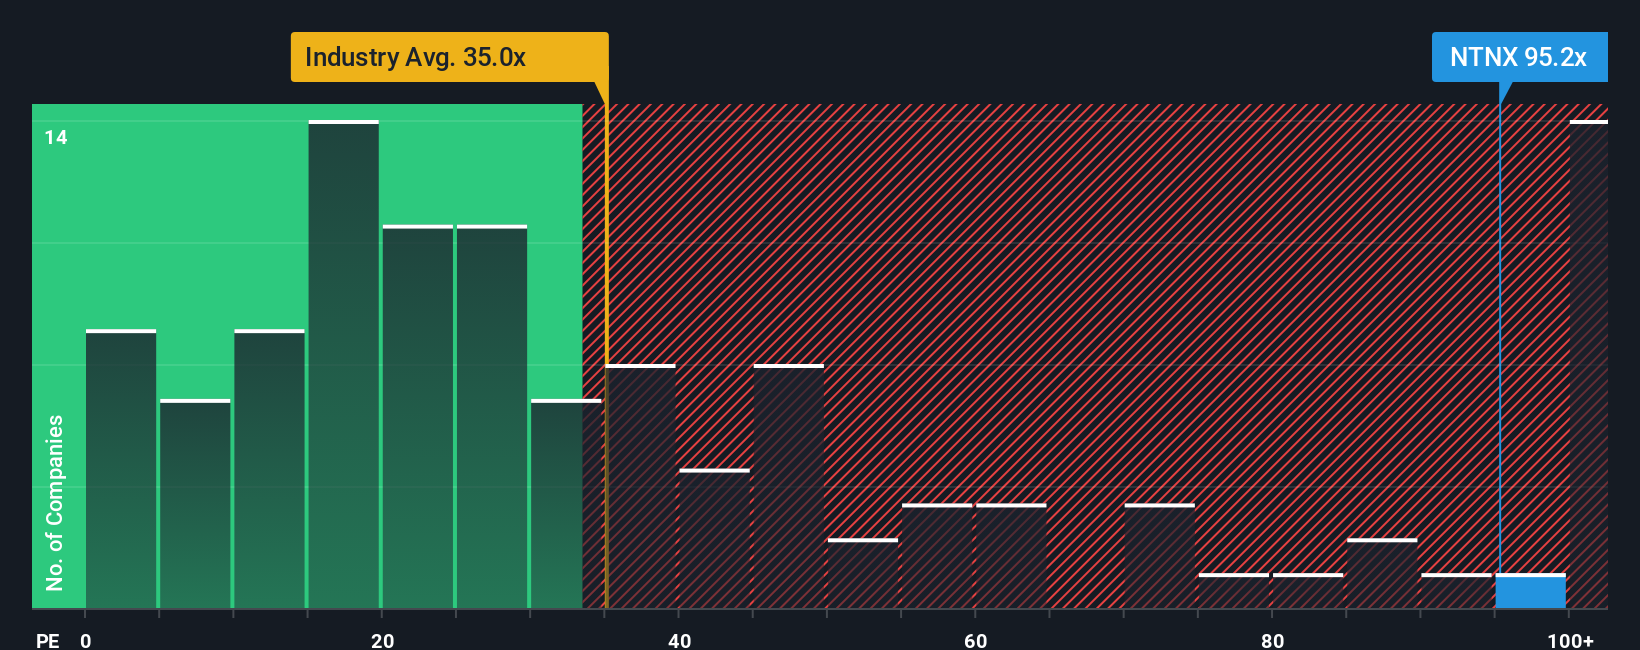
Nutanix currently trades on a P/E of 51.20x. That sits above the broader Software industry average P/E of 26.36x, but below the peer group average of 64.70x. To go a step further, Simply Wall St calculates a Fair Ratio for Nutanix of 40.52x. This is a proprietary estimate of what Nutanix’s P/E might be given its earnings growth profile, industry, profit margins, market cap and identified risks.
Because the Fair Ratio bakes in those company specific factors, it can offer a more tailored reference point than simple peer or industry comparisons. Set against the current P/E of 51.20x, Nutanix screens as trading above this Fair Ratio, which points to the shares looking overvalued on this metric.
Result: OVERVALUED
P/E ratios tell one story, but what if the real opportunity lies elsewhere? Start investing in legacies, not executives. Discover our 23 top founder-led companies.
Upgrade Your Decision Making: Choose your Nutanix Narrative
Earlier we mentioned that there is an even better way to understand valuation, so let us introduce you to Narratives, which are simply your story about a company linked to your own assumptions for future revenue, earnings, margins and fair value, then compared with today’s price to help you decide whether it feels like a buy, a hold or a sell for you.
On Simply Wall St’s Community page, Narratives let you set out that story in a structured but approachable way, so your view of Nutanix connects what you think is happening in its business to a forecast and then to a fair value that automatically updates when fresh news or earnings data are added.
For example, one Nutanix Narrative on the platform might lean closer to the higher analyst fair value around US$90.95, another might sit nearer the lower view around US$53.00, and seeing those side by side makes it clear how different assumptions about future growth, margins or P/E can lead reasonable investors to very different conclusions even when they are all looking at the same stock price on screen.
Do you think there's more to the story for Nutanix? Head over to our Community to see what others are saying!
This article by Simply Wall St is general in nature. We provide commentary based on historical data and analyst forecasts only using an unbiased methodology and our articles are not intended to be financial advice. It does not constitute a recommendation to buy or sell any stock, and does not take account of your objectives, or your financial situation. We aim to bring you long-term focused analysis driven by fundamental data. Note that our analysis may not factor in the latest price-sensitive company announcements or qualitative material. Simply Wall St has no position in any stocks mentioned.