Is Rigetti Computing (RGTI) Attractively Priced After Recent 33.5% Share Price Decline
Rigetti Computing, Inc. RGTI | 19.45 | +1.78% |
- If you have been wondering whether Rigetti Computing's share price still lines up with its fundamentals, this article will walk through what the numbers actually say about value.
- The stock last closed at US$16.97, with a 30 day return of 33.5% decline, a year to date return of 28.1% decline, and a 1 year return of 44.4% gain that sits alongside a very large 3 year return.
- Recent trading has been shaped by ongoing interest in quantum computing and how smaller specialists like Rigetti fit into that trend. Sector commentary and company updates around technology development and commercial partnerships have helped frame how investors think about both the upside potential and the risks in the shares.
- Rigetti currently has a valuation score of 2 out of 6. This means the stock screens as undervalued on only a couple of our checks. Next we will walk through the different valuation approaches that feed into that score and finish with a way to look at value that goes beyond any single metric.
Rigetti Computing scores just 2/6 on our valuation checks. See what other red flags we found in the full valuation breakdown.
Approach 1: Rigetti Computing Discounted Cash Flow (DCF) Analysis
A Discounted Cash Flow, or DCF, model takes projected future cash flows, discounts them back to today using a required return, and adds them up to estimate what the business might be worth right now.
For Rigetti Computing, the model used is a 2 Stage Free Cash Flow to Equity approach. The latest twelve month free cash flow is a loss of $60.48 million. Analyst and extrapolated forecasts then project free cash flow moving through a mix of negative and positive years, reaching $405.70 million in 2030. Later years are based on Simply Wall St extrapolations rather than direct analyst estimates.
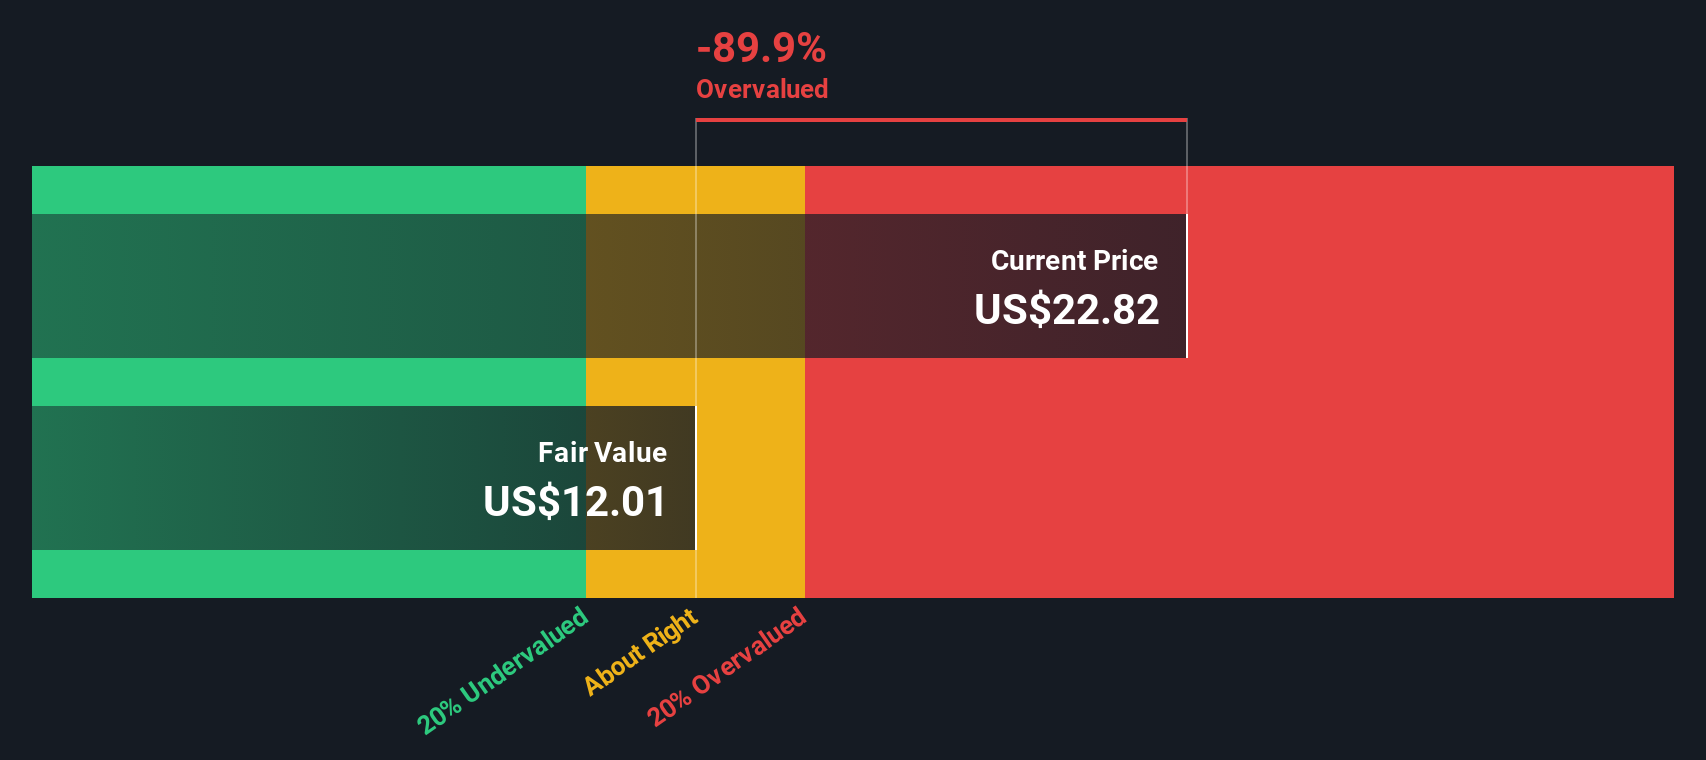
When all of those projected cash flows are discounted back to today, the model produces an estimated intrinsic value of about $47.07 per share. Compared with the recent share price of $16.97, the DCF indicates the stock is trading at a 63.9% discount to that estimate, which screens as materially undervalued on this method alone.
Result: UNDERVALUED
Our Discounted Cash Flow (DCF) analysis suggests Rigetti Computing is undervalued by 63.9%. Track this in your watchlist or portfolio, or discover 51 more high quality undervalued stocks.
Approach 2: Rigetti Computing Price vs Book (P/B)
For companies that are not yet consistently profitable, price-based multiples that rely on earnings can be hard to interpret, so price to book is often a more useful cross-check because it anchors the valuation to the net assets on the balance sheet.
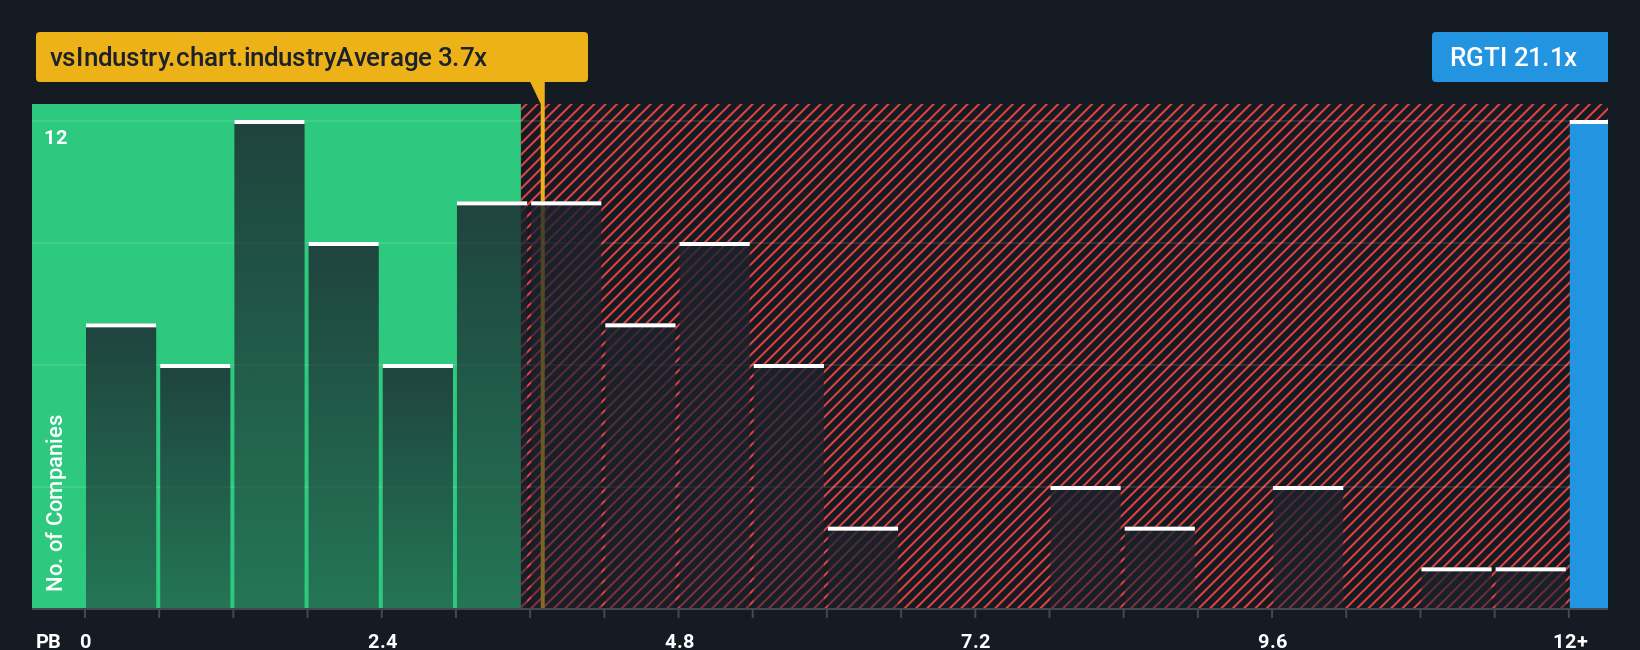
In simple terms, higher growth expectations and lower perceived risk can justify a higher normal P/B ratio, while slower growth or higher uncertainty usually call for a lower one. Rigetti currently trades on a P/B of 15.06x. That sits above both the Semiconductor industry average P/B of 4.59x and a peer group average of 5.04x, so on a plain comparison the shares look expensive relative to assets.
Simply Wall St also uses a Fair Ratio for P/B, which is the multiple it would expect given factors like earnings growth, industry, profit margin, market cap and risk profile. This tends to be more tailored than simple peer or industry checks because it blends those company specific drivers into a single benchmark. In this case, the Fair Ratio is not available, so it is not possible to say whether 15.06x points to the stock being overvalued, undervalued or about right based on this model alone.
Result: ABOUT RIGHT
P/B ratios tell one story, but what if the real opportunity lies elsewhere? Start investing in legacies, not executives. Discover our 23 top founder-led companies.
Upgrade Your Decision Making: Choose your Rigetti Computing Narrative
Earlier we mentioned that there is an even better way to think about value than any single metric. On Simply Wall St that shows up as Narratives, where you and other investors connect Rigetti Computing's story to specific revenue, earnings and margin assumptions, turn those into a fair value, and then compare that fair value with the current price on the Community page. Each Narrative updates automatically when new news or earnings arrive, so you can see, for example, one investor valuing Rigetti at US$24.50 based on their expectations and another at US$51.00, then decide for yourself which story you find more compelling.
Do you think there's more to the story for Rigetti Computing? Head over to our Community to see what others are saying!

This article by Simply Wall St is general in nature. We provide commentary based on historical data and analyst forecasts only using an unbiased methodology and our articles are not intended to be financial advice. It does not constitute a recommendation to buy or sell any stock, and does not take account of your objectives, or your financial situation. We aim to bring you long-term focused analysis driven by fundamental data. Note that our analysis may not factor in the latest price-sensitive company announcements or qualitative material. Simply Wall St has no position in any stocks mentioned.