Is Starbucks (SBUX) Pricing Look Stretched After Recent Share Price Rebound
Starbucks Corporation SBUX | 98.34 98.08 | -0.13% -0.26% Pre |
- If you are wondering whether Starbucks at around US$96.07 is a bargain or a stock to be cautious with, the answer really comes down to what you think its true underlying value is today.
- Over the very short term, the share price has moved, with returns of 2.3% over 7 days, 7.4% over 30 days and 14.4% year to date. The 1 year and 3 year returns sit at an 11.7% decline and a 3.1% decline, and the 5 year return is 1.6%.
- These moves sit against an ongoing flow of news about Starbucks, including regular updates on its global store footprint, product launches and commentary from management in interviews and public appearances. Together, these pieces of information influence how investors think about the company, which can affect sentiment around the stock price.
- On our checks, Starbucks currently has a valuation score of 0 out of 6. Next we will look at how different valuation methods interpret that score, before finishing with a broader way to think about value that goes beyond any single model.
Starbucks scores just 0/6 on our valuation checks. See what other red flags we found in the full valuation breakdown.
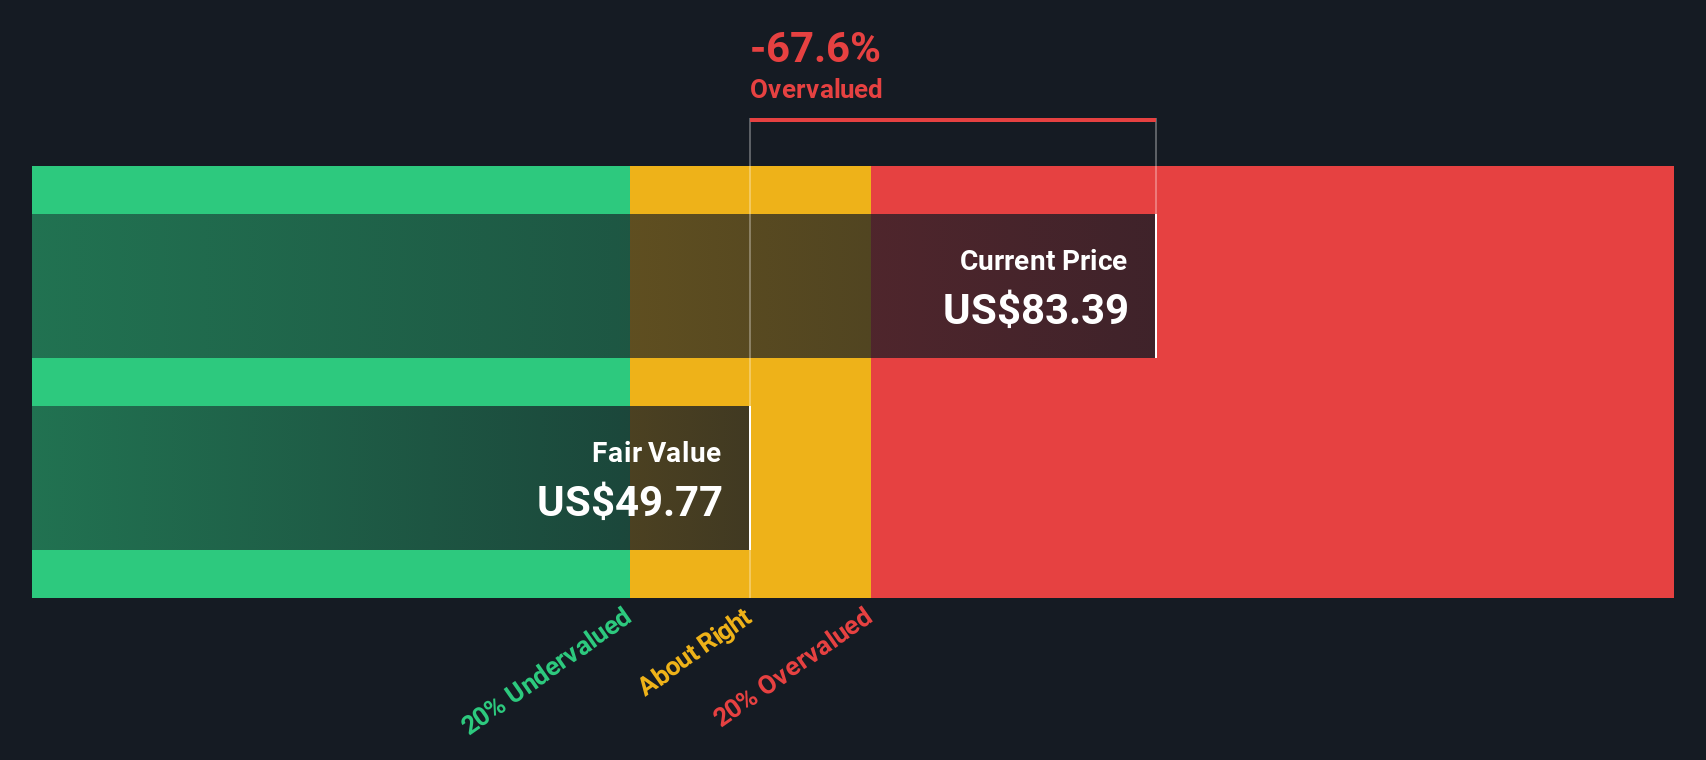
Approach 1: Starbucks Discounted Cash Flow (DCF) Analysis
A Discounted Cash Flow, or DCF, model estimates what a company might be worth today by projecting its future cash flows and then discounting those cash flows back to a single present value figure.
For Starbucks, the model used is a 2 Stage Free Cash Flow to Equity approach. The latest twelve month free cash flow is about $1.81b. Analysts and extrapolated estimates suggest free cash flow reaching around $4.45b in 2029, with a set of yearly projections between 2026 and 2035 that are discounted back to today using Simply Wall St’s methodology.
Putting all of those projected cash flows together, the DCF model suggests an estimated intrinsic value of about $72.92 per share. Compared with the current share price of around $96.07, this implies the stock is roughly 31.7% richer than the model’s estimate. This points to Starbucks trading at a premium on this measure.
Result: OVERVALUED
Our Discounted Cash Flow (DCF) analysis suggests Starbucks may be overvalued by 31.7%. Discover 55 high quality undervalued stocks or create your own screener to find better value opportunities.
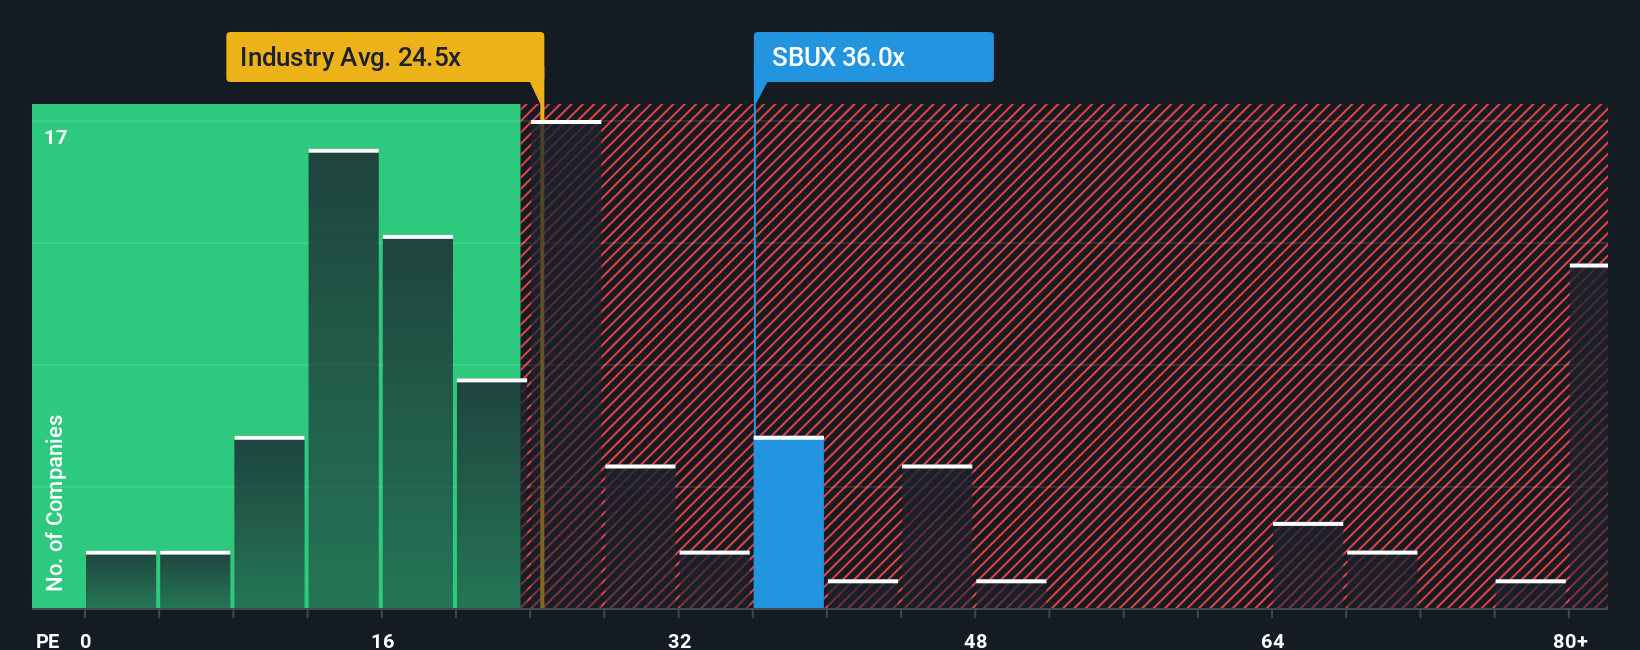
Approach 2: Starbucks Price vs Earnings (P/E)
For a profitable company like Starbucks, the P/E ratio is a common way to gauge how much investors are paying for each dollar of earnings. A higher P/E often reflects higher expected growth or lower perceived risk, while a lower P/E can point to lower growth expectations or higher risk.
Starbucks currently trades on a P/E of about 80x. That sits above the Hospitality industry average of around 21x and also above the peer group average of roughly 45x. On the face of it, that suggests investors are paying a premium compared with both the sector and similar companies.
Simply Wall St’s Fair Ratio for Starbucks is 49.30x. This is a proprietary estimate of what Starbucks’ P/E could be given factors like its earnings growth profile, industry, profit margins, market cap and specific risks. Because it blends these company specific inputs, the Fair Ratio is designed to be more tailored than a simple comparison with broad industry or peer averages. Lining this up against the current 80x P/E implies Starbucks is trading richer than this Fair Ratio estimate.
Result: OVERVALUED
P/E ratios tell one story, but what if the real opportunity lies elsewhere? Start investing in legacies, not executives. Discover our 22 top founder-led companies.
Upgrade Your Decision Making: Choose your Starbucks Narrative
Earlier we mentioned that there is an even better way to understand valuation, so let us introduce you to Narratives, which are simply your story about a company, linked directly to your own assumptions for fair value, future revenue, earnings and margins.
On Simply Wall St, Narratives sit inside the Community page and give you a clear bridge from the company story to a financial forecast, and then to a fair value that you can compare with today’s share price to help you decide whether you are closer to buying, holding, or selling.
Because Narratives on the platform are refreshed when new information comes in, like earnings releases or major news, your view of Starbucks is not fixed on a single model but can adjust as the facts change.
For example, one Starbucks Narrative might assume a higher revenue path and stronger margins that justify a higher fair value, while another might assume more modest growth and tighter margins that point to a lower fair value, and both can sit side by side so you can see how different views translate into different price signals.
Do you think there's more to the story for Starbucks? Head over to our Community to see what others are saying!

This article by Simply Wall St is general in nature. We provide commentary based on historical data and analyst forecasts only using an unbiased methodology and our articles are not intended to be financial advice. It does not constitute a recommendation to buy or sell any stock, and does not take account of your objectives, or your financial situation. We aim to bring you long-term focused analysis driven by fundamental data. Note that our analysis may not factor in the latest price-sensitive company announcements or qualitative material. Simply Wall St has no position in any stocks mentioned.