Is There Now An Opportunity In FMC (FMC) After The Sharp Multi Year Share Price Slump
FMC Corporation FMC | 17.42 17.44 | -3.60% +0.11% Pre |
- If you are looking at FMC and wondering whether today’s price gives you genuine value or just a value trap, this article will walk through what the numbers actually say about the stock.
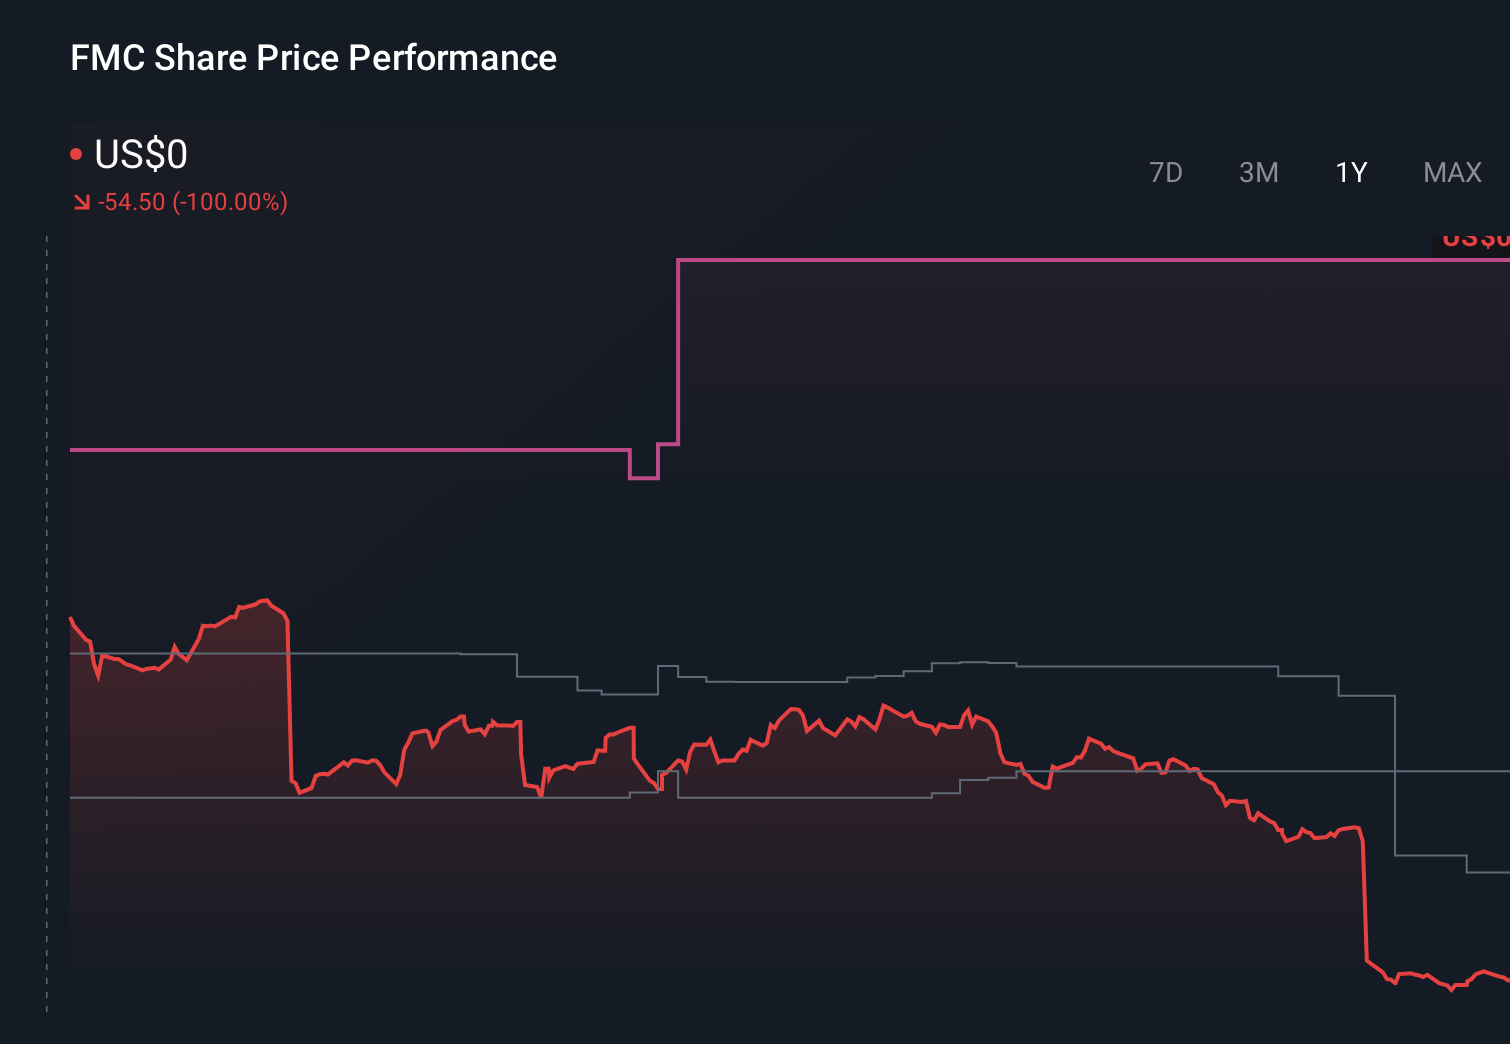
- The share price closed at US$13.67, with returns of a 14.1% decline over the past 7 days, 7.9% decline over 30 days, 4.7% decline year to date, 59.7% decline over 1 year, 88.1% decline over 3 years and 85.5% decline over 5 years. This performance is likely to catch the eye of investors reassessing risk and potential reward.
- Recent coverage of FMC has focused on broader questions about the outlook for agricultural inputs and how investors are reassessing companies that serve that space. This context around sector sentiment and business conditions helps explain why the share price has reset so sharply and why valuation is now front and center for many shareholders.
- On our framework, FMC records a valuation score of 5 out of 6, which suggests it screens as undervalued on most of the checks we run. Next we look at how different valuation methods line up on FMC and then finish with a way to think about value that goes beyond the usual ratios.
Approach 1: FMC Discounted Cash Flow (DCF) Analysis
Approach 1: FMC Discounted Cash Flow (DCF) Analysis
A Discounted Cash Flow, or DCF, model takes projected future cash flows and discounts them back to what they are worth today, using a required rate of return. It aims to estimate what a business could be worth based purely on the cash it is expected to generate for shareholders.
For FMC, the model used is a 2 Stage Free Cash Flow to Equity approach. The latest twelve month free cash flow is a loss of $163.6 million, so the valuation leans on forward expectations. Analyst and extrapolated estimates point to free cash flow reaching $395.5 million in 2035, with interim projections such as $285.0 million in 2026, $354.1 million in 2027 and $330.0 million in 2029. These figures are provided in $ and are all below $1b, so they are best viewed in millions.
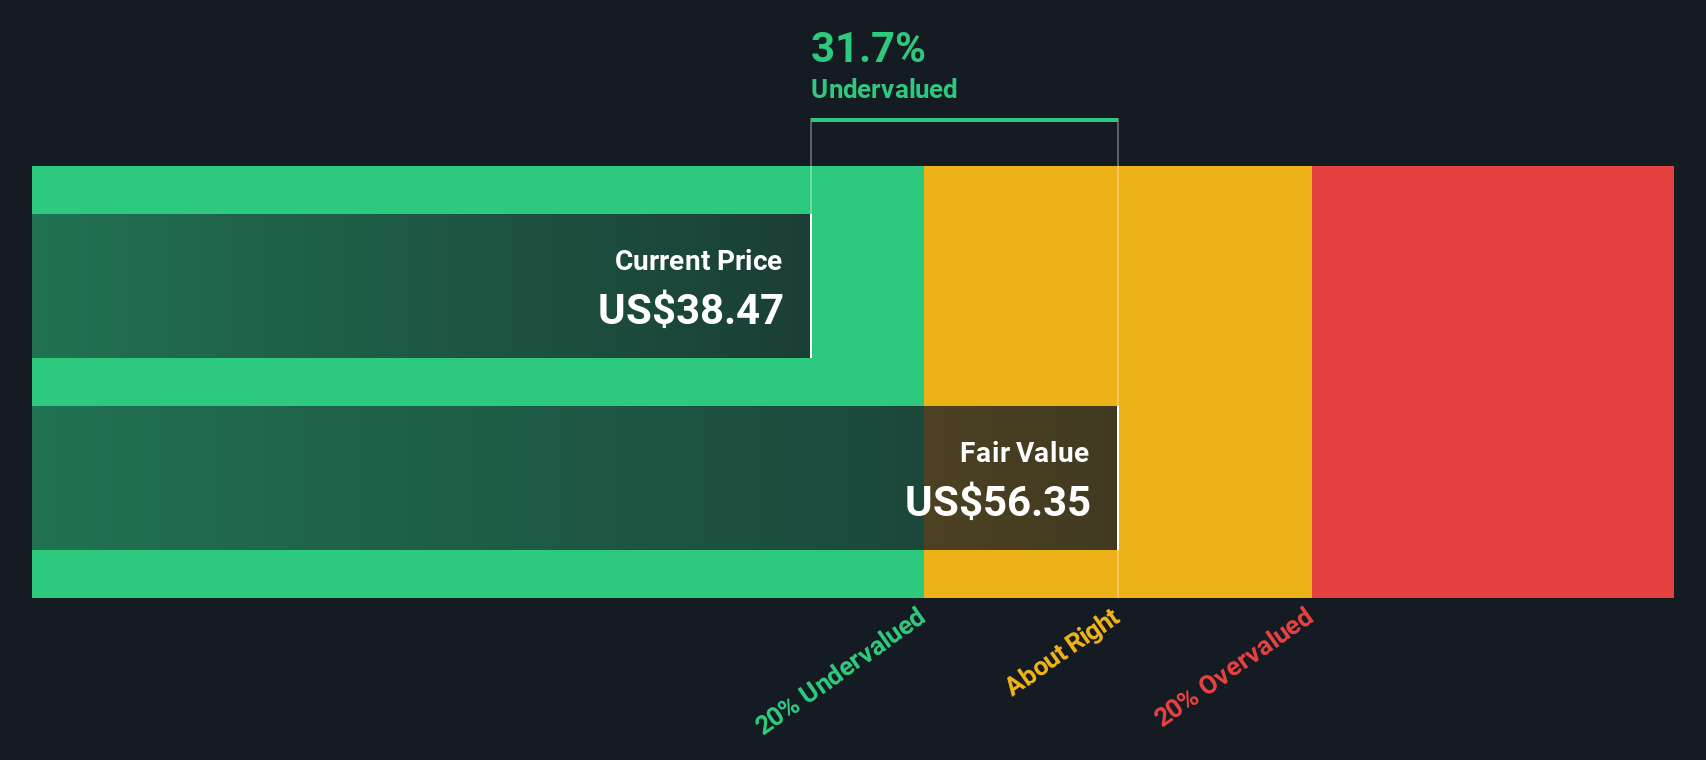
When all these projected cash flows are discounted back, the model arrives at an estimated intrinsic value of about $30.51 per share. Compared with the recent share price of $13.67, this DCF output implies the stock screens as significantly undervalued based on these assumptions.
Result: UNDERVALUED
Our Discounted Cash Flow (DCF) analysis suggests FMC is undervalued by 55.2%. Track this in your watchlist or portfolio, or discover 55 more high quality undervalued stocks.
Approach 2: FMC Price vs Sales
For companies where earnings are currently weak or volatile, the P/S ratio can be a useful way to think about value because it compares what you pay for each dollar of revenue rather than profit. What investors usually consider a “normal” or “fair” P/S depends on how quickly they expect those sales to grow and how risky they think the business is.
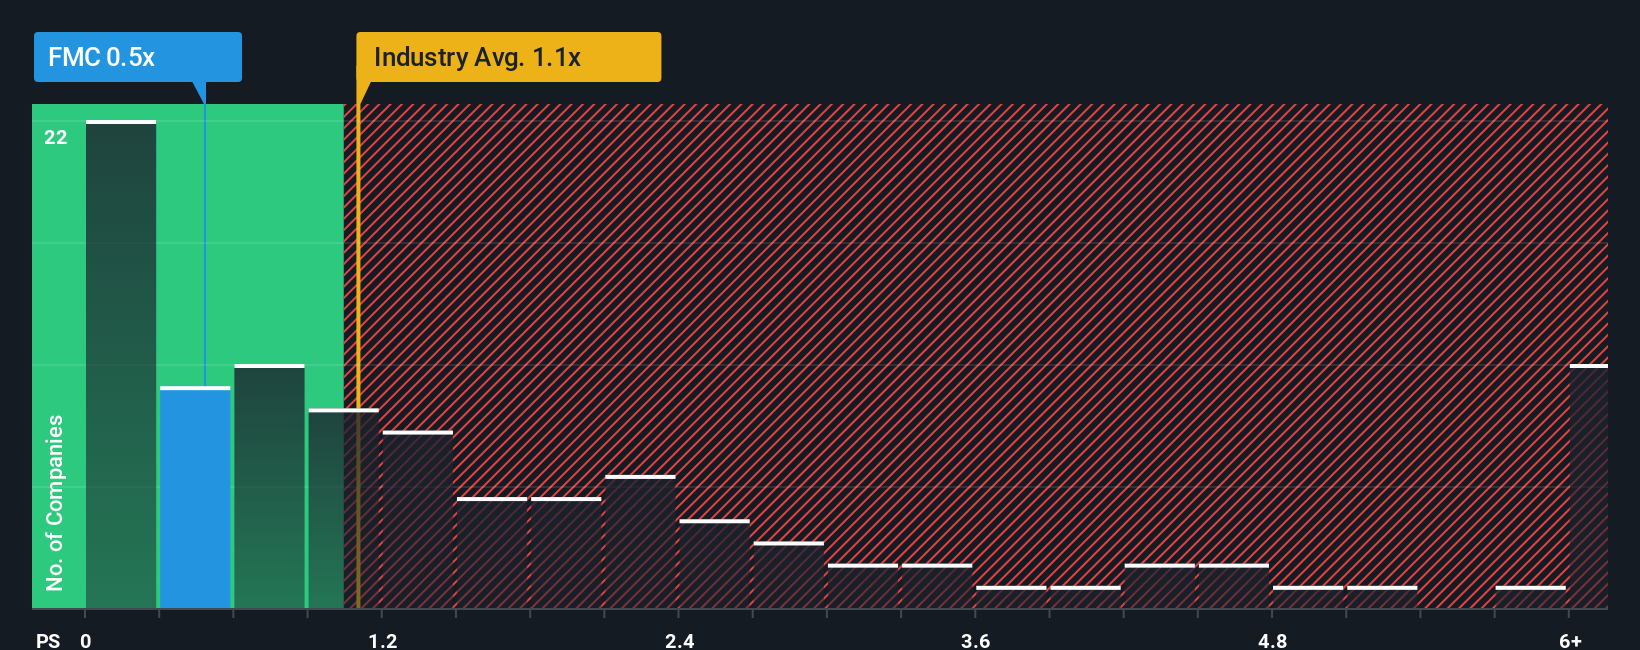
FMC currently trades on a P/S of 0.49x. That sits below the Chemicals industry average P/S of 1.13x and the peer group average of 1.43x, so the market is pricing FMC’s sales at a discount to many competitors.
Simply Wall St’s Fair Ratio framework goes a step further. It estimates what a reasonable P/S multiple could be for FMC based on factors like its earnings growth profile, industry, profit margin, market cap and risk characteristics. For FMC, the Fair Ratio comes out at 1.63x, which is comfortably above the current 0.49x P/S. On this yardstick, the stock screens as undervalued relative to what that model would suggest.
Result: UNDERVALUED
P/S ratios tell one story, but what if the real opportunity lies elsewhere? Start investing in legacies, not executives. Discover our 22 top founder-led companies.
Upgrade Your Decision Making: Choose your FMC Narrative
Earlier we mentioned that there is an even better way to understand valuation, so let us introduce you to Narratives, which are simply your story about FMC, written in numbers like your fair value, revenue, earnings and margin assumptions.
A Narrative connects what you believe about FMC’s business, such as product strength or competitive pressures, to a financial forecast and then to a fair value estimate that you can compare directly with today’s share price.
On Simply Wall St’s Community page, millions of investors use Narratives as an accessible tool to set their own assumptions, see the resulting fair value, and quickly judge whether the current price suggests FMC could be expensive or cheap for their particular view.
Because Narratives update automatically when new information such as results or news is added to the platform, your fair value stays aligned with the latest data, and you can see at a glance whether your FMC story still holds. For example, one investor might use very cautious revenue growth and low margins to reach a fair value near the bottom of the community range, while another uses stronger growth and higher margins to arrive near the top.
Do you think there's more to the story for FMC? Head over to our Community to see what others are saying!
This article by Simply Wall St is general in nature. We provide commentary based on historical data and analyst forecasts only using an unbiased methodology and our articles are not intended to be financial advice. It does not constitute a recommendation to buy or sell any stock, and does not take account of your objectives, or your financial situation. We aim to bring you long-term focused analysis driven by fundamental data. Note that our analysis may not factor in the latest price-sensitive company announcements or qualitative material. Simply Wall St has no position in any stocks mentioned.