Is There Still Opportunity In Amgen (AMGN) After Its 24% One-Year Share Price Gain
Amgen Inc. AMGN | 0.00 |
- If you are wondering whether Amgen's share price still offers value, or if most of the opportunity is already priced in, this article walks through what the current valuation signals may be indicating.
- Amgen's stock recently closed at US$345.60, with returns of 2.7% over the last week, 4.9% over the last month, 5.5% year to date and 24.0% over the past year, which has many investors reassessing both its potential and its risks.
- Recent headlines around Amgen have focused on its position in large cap biotech, including ongoing attention on how its product portfolio and pipeline relate to long term expectations for the business. At the same time, broader sector sentiment has put more focus on whether established biopharma stocks like Amgen still offer value compared with faster growing peers.
- Simply Wall St's valuation model gives Amgen a score of 4 out of 6. The following sections explain what this means across different valuation approaches, and conclude with a framework that can help you judge whether the current price aligns with your own view of the stock.
Approach 1: Amgen Discounted Cash Flow (DCF) Analysis
A Discounted Cash Flow, or DCF, model projects the cash a company is expected to generate in the future and then discounts those cash flows back to today to estimate what the business might be worth right now.
For Amgen, the model used is a 2 Stage Free Cash Flow to Equity approach, based on cash flow projections rather than earnings. The latest twelve month Free Cash Flow is about $9.1b. Analysts provide explicit forecasts for the next few years, and Simply Wall St then extrapolates further out, with projected Free Cash Flow of $16.7b in 2030. Those annual cash flows are discounted back to today using an appropriate rate to reflect risk and the time value of money.
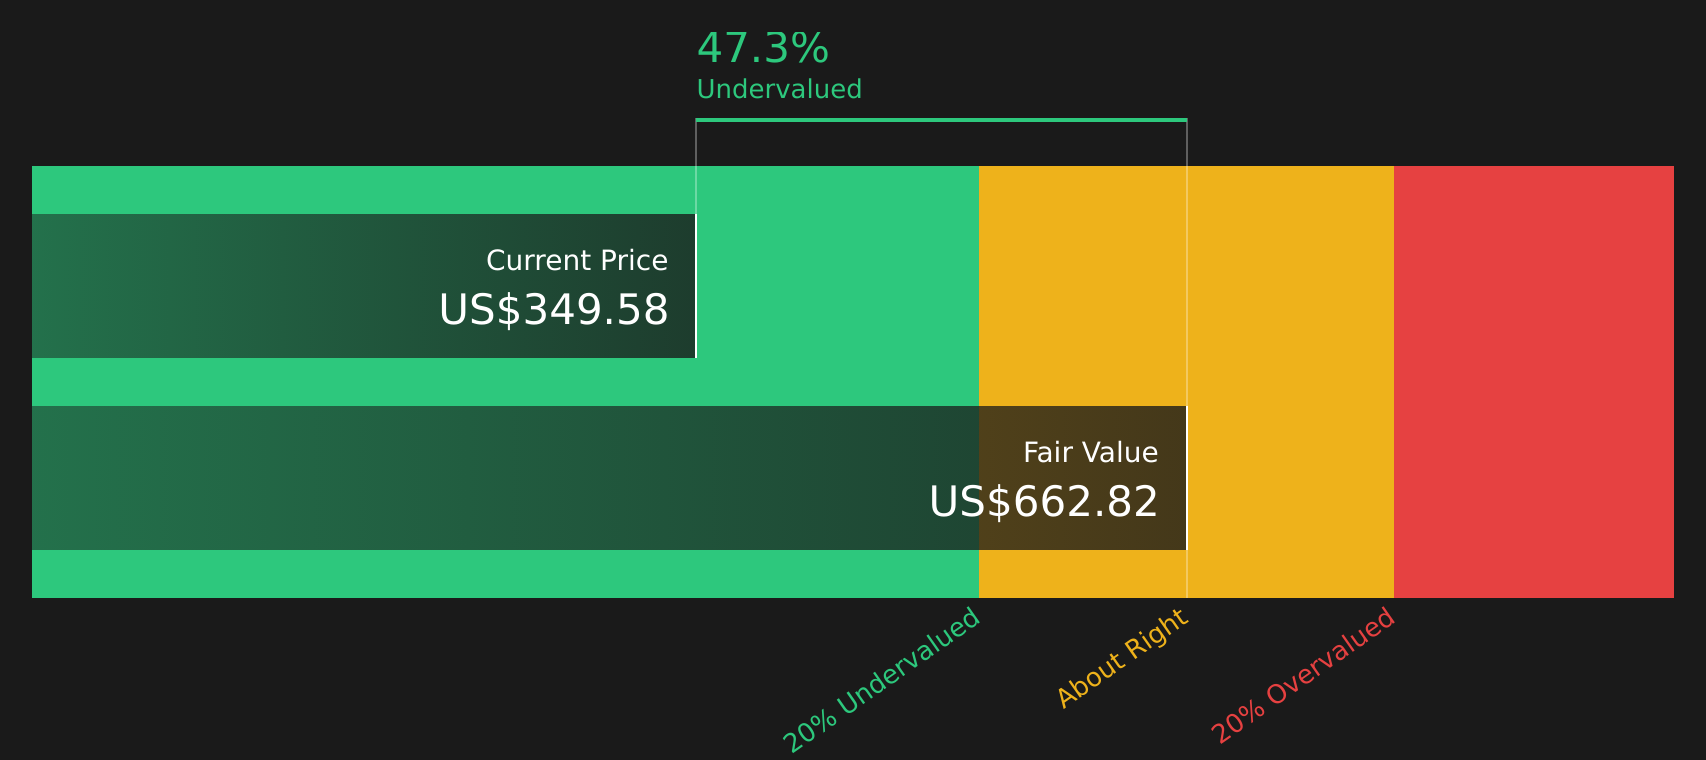
On this basis, the DCF model estimates an intrinsic value of about $663.12 per share. Compared with the recent share price of $345.60, this implies the stock trades at a 47.9% discount to that intrinsic value, which points to Amgen being assessed as significantly undervalued on this model alone.
Result: UNDERVALUED
Our Discounted Cash Flow (DCF) analysis suggests Amgen is undervalued by 47.9%. Track this in your watchlist or portfolio, or discover 47 more high quality undervalued stocks.
Approach 2: Amgen Price vs Earnings (P/E)
For profitable companies like Amgen, the P/E ratio is a useful way to think about valuation because it links what you pay for each share to the earnings that each share generates today.
What counts as a “normal” P/E depends a lot on expectations and risk. Higher growth and more predictable earnings can justify a higher multiple, while slower growth or higher uncertainty usually call for a lower one.
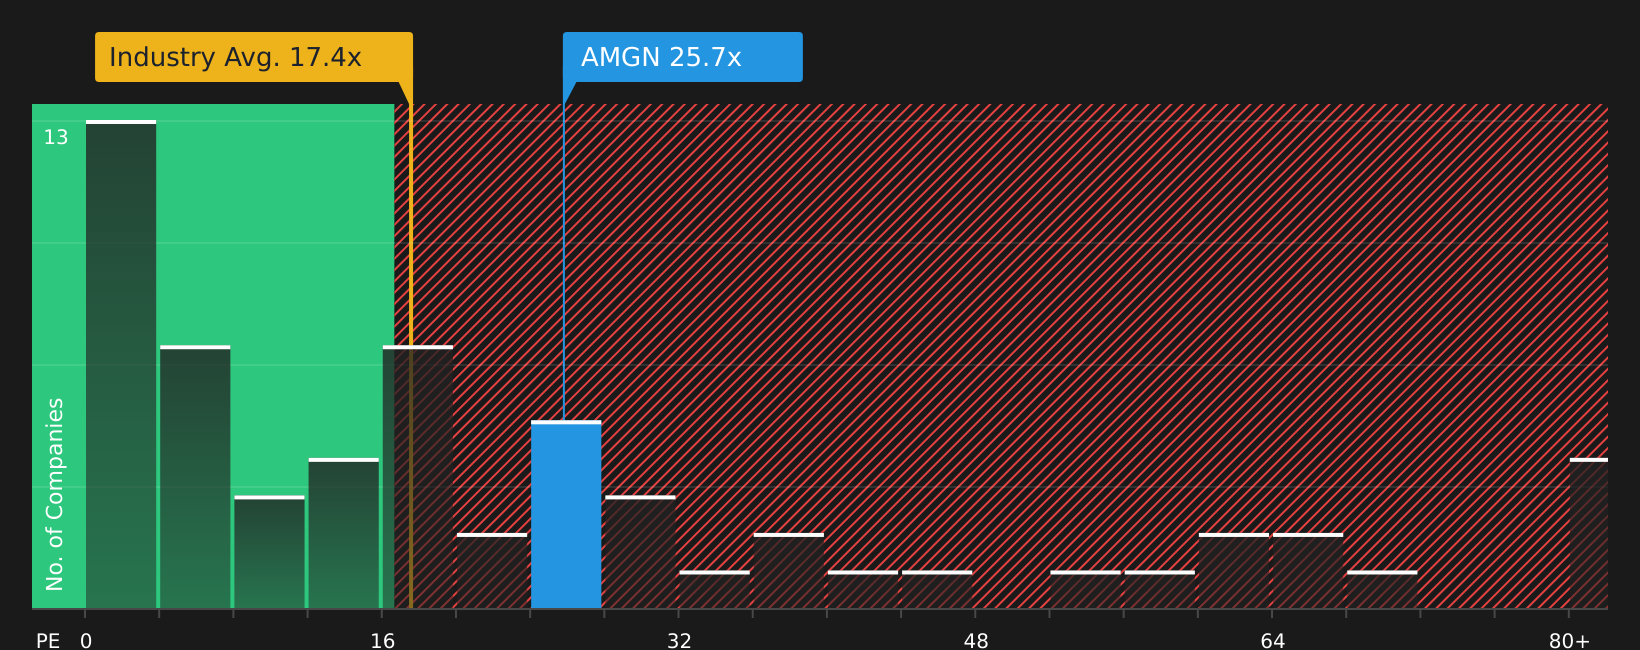
Amgen currently trades on a P/E of 23.9x. That sits above the broader Biotechs industry average of 16.6x, but below the peer group average of 42.1x, so the stock is neither at the low end nor the high end of what investors are paying for earnings in this space.
Simply Wall St’s Fair Ratio for Amgen is 24.4x. This is a proprietary estimate of what the P/E might be given factors like earnings growth, profit margins, industry, market cap and company specific risks. Because it blends these elements, it can be more tailored than a simple comparison to peers or the industry average alone.
With the Fair Ratio of 24.4x sitting very close to the actual P/E of 23.9x, the model views Amgen’s current earnings based valuation as broadly in line with those fundamentals.
Result: ABOUT RIGHT
P/E ratios tell one story, but what if the real opportunity lies elsewhere? Start investing in legacies, not executives. Discover our 21 top founder-led companies.
Upgrade Your Decision Making: Choose your Amgen Narrative
Earlier it was mentioned that there is an even better way to understand valuation. Narratives are introduced as a simple way for you to attach a clear story about Amgen to the numbers you care about, such as fair value and estimates of future revenue, earnings and margins. You can then link that story directly to a financial forecast and a fair value that can be compared with the current share price to help you decide whether the stock looks attractive or expensive on your terms.
On Simply Wall St’s Community page, Narratives are available as an accessible tool used by millions of investors, and Amgen is a good example of how this works in practice. One bullish Narrative points to a Fair Value of US$432.00 per share and a more cautious Narrative points to US$243.49. This allows you to see how different assumptions about issues like drug pricing pressure, biosimilar competition or the potential of therapies such as MariTide or Uplizna lead to very different conclusions. All of these Narratives update automatically as fresh news, guidance or earnings are incorporated into the models.
For Amgen, however, we will make it really easy for you with previews of two leading Amgen Narratives:
Fair value: US$352.23 per share
Implied discount to this fair value from the recent close around US$345.60: about 1.9%
Analyst modeled revenue growth used in this narrative: about 2.53% a year
- Analysts building this fair value see Amgen increasing revenue and profit margins over the next few years, supported by growth in therapies for chronic and age related conditions and a broad late stage pipeline.
- They also factor in contributions from the biosimilars portfolio, digital transformation and deeper penetration into under treated patient groups, while acknowledging risks from pricing pressure, competition, R&D intensity and regulation.
- The consensus price target of about US$352 per share reflects those assumptions and implies that, on this view, the stock is close to fairly priced. Your own stance comes down to how much confidence you place in those growth and margin expectations.
Fair value: US$243.49 per share
Implied premium to this fair value from the recent close around US$345.60: about 41.9%
Analyst modeled revenue trend used in this narrative: revenue is assumed to be roughly flat, with a decline of about 0.07% a year
- The bearish narrative puts more weight on pressure from aging therapies, patent expirations, pricing reforms and tougher competition, which together are modeled to limit revenue growth and slightly compress profit margins over time.
- This view also highlights execution risk around acquisitions and higher spending on R&D and manufacturing, which could weigh on margins if newer products and rare disease assets do not fully offset those headwinds.
- Using these more cautious assumptions, the implied fair value of about US$243 per share sits well below the recent share price. Investors who lean toward this scenario may see less room for upside unless the business performance outpaces these expectations.
If you want to see these stories fully laid out alongside detailed forecasts and underlying assumptions, it is worth reading both narratives in full and deciding which set of expectations feels closer to your own view of Amgen.
To see how these results tie into long-term growth, risks, and valuation, check out the full range of community narratives for Amgen on Simply Wall St. Add the company to your watchlist or portfolio so you'll be alerted when the story evolves.
Do you think there's more to the story for Amgen? Head over to our Community to see what others are saying!

This article by Simply Wall St is general in nature. We provide commentary based on historical data and analyst forecasts only using an unbiased methodology and our articles are not intended to be financial advice. It does not constitute a recommendation to buy or sell any stock, and does not take account of your objectives, or your financial situation. We aim to bring you long-term focused analysis driven by fundamental data. Note that our analysis may not factor in the latest price-sensitive company announcements or qualitative material. Simply Wall St has no position in any stocks mentioned.