Lennar (LEN) Stock After Recent Slide And DCF Fair Value Check
Lennar Corporation Class A LEN | 0.00 |
- If you are wondering whether Lennar stock is starting to look attractive or still has room to fall, the recent share moves and current valuation metrics provide some useful clues.
- The stock last closed at US$86.48, with the share price declining 3.8% over the past week, edging up 3.2% over the last month, and still down 17.0% year to date and 14.8% over the past year.
- These moves are playing out against a backdrop where Lennar has remained in focus for long term investors. Attention is on how the company is positioned within the Consumer Durables sector and how its balance of risks and opportunities is being reassessed. This context helps explain why some investors are watching valuation metrics more closely rather than reacting only to short term price swings.
- Lennar currently holds a value score of 2 out of 6, meaning it screens as undervalued on two of the six checks used. The rest of this article will walk through traditional valuation approaches and then finish with a more rounded way to understand whether that score reflects the full story.
Lennar scores just 2/6 on our valuation checks. See what other red flags we found in the full valuation breakdown.
Approach 1: Lennar Discounted Cash Flow (DCF) Analysis
A Discounted Cash Flow, or DCF, model estimates what Lennar stock might be worth by projecting future cash flows and discounting them back to today using a required rate of return. It is essentially asking what all those future cash flows are worth in present dollar terms.
For Lennar, the model used is a 2 Stage Free Cash Flow to Equity approach. The latest reported Free Cash Flow is a loss of $82.13 million, so the starting point is relatively weak, but analysts and extrapolated estimates map out a path where Free Cash Flow reaches $1.82 billion in 2035. For example, projected Free Cash Flow is $632 million in 2026 and $852.13 million in 2027, with Simply Wall St extrapolating further years beyond the analyst horizon.
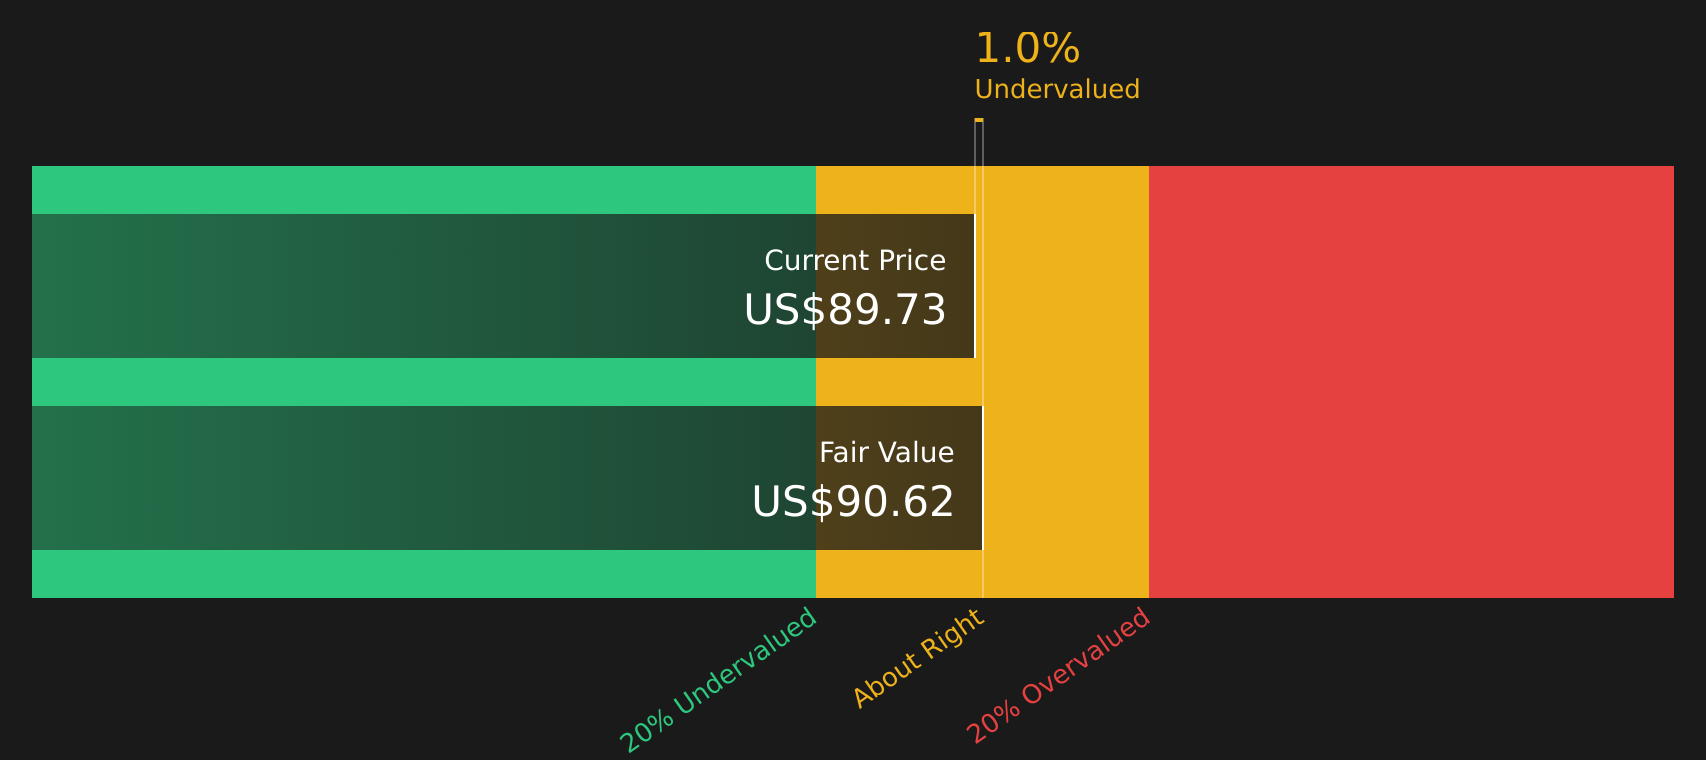
Discounting this stream of projected Free Cash Flow back to today gives an estimated intrinsic value of about $90.88 per share. Compared with the recent share price of $86.48, the DCF implies Lennar is around 4.8% undervalued, which is a relatively small gap that could easily move either way as assumptions change.
Result: ABOUT RIGHT
Lennar is fairly valued according to our Discounted Cash Flow (DCF), but this can change at a moment's notice. Track the value in your watchlist or portfolio and be alerted on when to act.
Approach 2: Lennar Price vs Earnings
For a profitable company like Lennar, the P/E ratio is a useful shorthand for how much you are paying for each dollar of current earnings. It helps you compare what the market is willing to pay for Lennar stock against other companies that are also generating earnings today.
What counts as a “normal” or “fair” P/E depends on expectations for future earnings growth and the risks around those earnings. Higher expected growth and lower perceived risk usually justify a higher P/E, while lower growth expectations or higher risk tend to support a lower P/E.
Lennar currently trades on a P/E of 13.35x. That sits slightly above the Consumer Durables industry average of 12.99x and above the peer group average of 12.38x. Simply Wall St’s Fair Ratio for Lennar is 21.16x, which is a proprietary estimate of the P/E that might be expected given factors such as earnings growth profile, profit margins, industry, market cap and key risks.
This Fair Ratio can be more informative than a simple peer or industry comparison because it adjusts for Lennar’s specific characteristics rather than assuming all companies deserve the same multiple. With the current P/E of 13.35x below the Fair Ratio of 21.16x, Lennar screens as undervalued on this measure.
Result: UNDERVALUED

P/E ratios tell one story, but what if the real opportunity lies elsewhere? Start investing in legacies, not executives. Discover our 20 top founder-led companies.
Upgrade Your Decision Making: Choose your Lennar Narrative
Earlier it was mentioned that there is an even better way to understand valuation. This is where Narratives come in, giving you a clear story behind the numbers for Lennar by linking your view of its business, revenue, earnings and margins to a forecast and then to a Fair Value that you can compare with the current share price.
A Narrative on Simply Wall St is your own Lennar storyline expressed in numbers. You decide what you think about factors like the asset light model, housing demand and margin pressure, and the platform turns that view into projected financials and an implied Fair Value in a format that is easy to review and adjust.
These Narratives live on Lennar’s Community page, are available to the millions of investors using the platform, and update automatically when fresh information such as earnings or news is added. Your Fair Value estimate moves as the facts change rather than staying stuck on old assumptions.
For example, one Lennar investor might align with the higher US$153.41 to US$159.0 Fair Value range, focusing on asset light execution and earnings power. Another might lean toward the US$74.0 bearish Fair Value, prioritizing concerns about land banking costs, incentives and softer demand, and each can quickly see how far those views sit from today’s share price.
For Lennar however we will make it really easy for you with previews of two leading Lennar Narratives:
Fair value: US$91.50 per share
Implied undervaluation vs last close: about 5.5% below this fair value
Analyst revenue growth assumption: 5.32% a year
- Focuses on Lennar shifting further toward an asset light, land light model and just in time delivery to support cash flow and future net margins.
- Builds on analysts assuming revenue growth of 5.3% a year, slightly lower profit margins over the next three years and earnings of about US$1.9b by 2029.
- Anchors on a consensus fair value of US$91.50, with the view that current pricing and a 13.4x P/E in 2029 would be reasonable if these forecasts play out.
Fair value: US$74.00 per share
Implied overvaluation vs last close: about 16.7% above this fair value
Bear case revenue growth assumption: 2.76% a year
- Emphasizes a slower 2.8% annual revenue growth path, thinner profit margins at about 4.2% in three years and earnings closer to US$1.5b by 2029.
- Highlights concerns that high mortgage rates, heavier incentives and an expensive land banking approach could weigh on returns and keep margins subdued.
- Uses a fair value of US$74.00 and a 13.4x P/E on 2029 earnings to argue that Lennar stock may be pricing in more optimism than these assumptions support.
If you want to see how other investors connect these numbers to a full Lennar storyline, you can review the community narratives side by side using See what the community is saying about Lennar.
Do you think there's more to the story for Lennar? Head over to our Community to see what others are saying!

This article by Simply Wall St is general in nature. We provide commentary based on historical data and analyst forecasts only using an unbiased methodology and our articles are not intended to be financial advice. It does not constitute a recommendation to buy or sell any stock, and does not take account of your objectives, or your financial situation. We aim to bring you long-term focused analysis driven by fundamental data. Note that our analysis may not factor in the latest price-sensitive company announcements or qualitative material. Simply Wall St has no position in any stocks mentioned.