Lumen Technologies (LUMN) Near Breakeven Q4 EPS Challenges Prolonged Loss Narratives
Lumen LUMN | 8.51 | -0.93% |
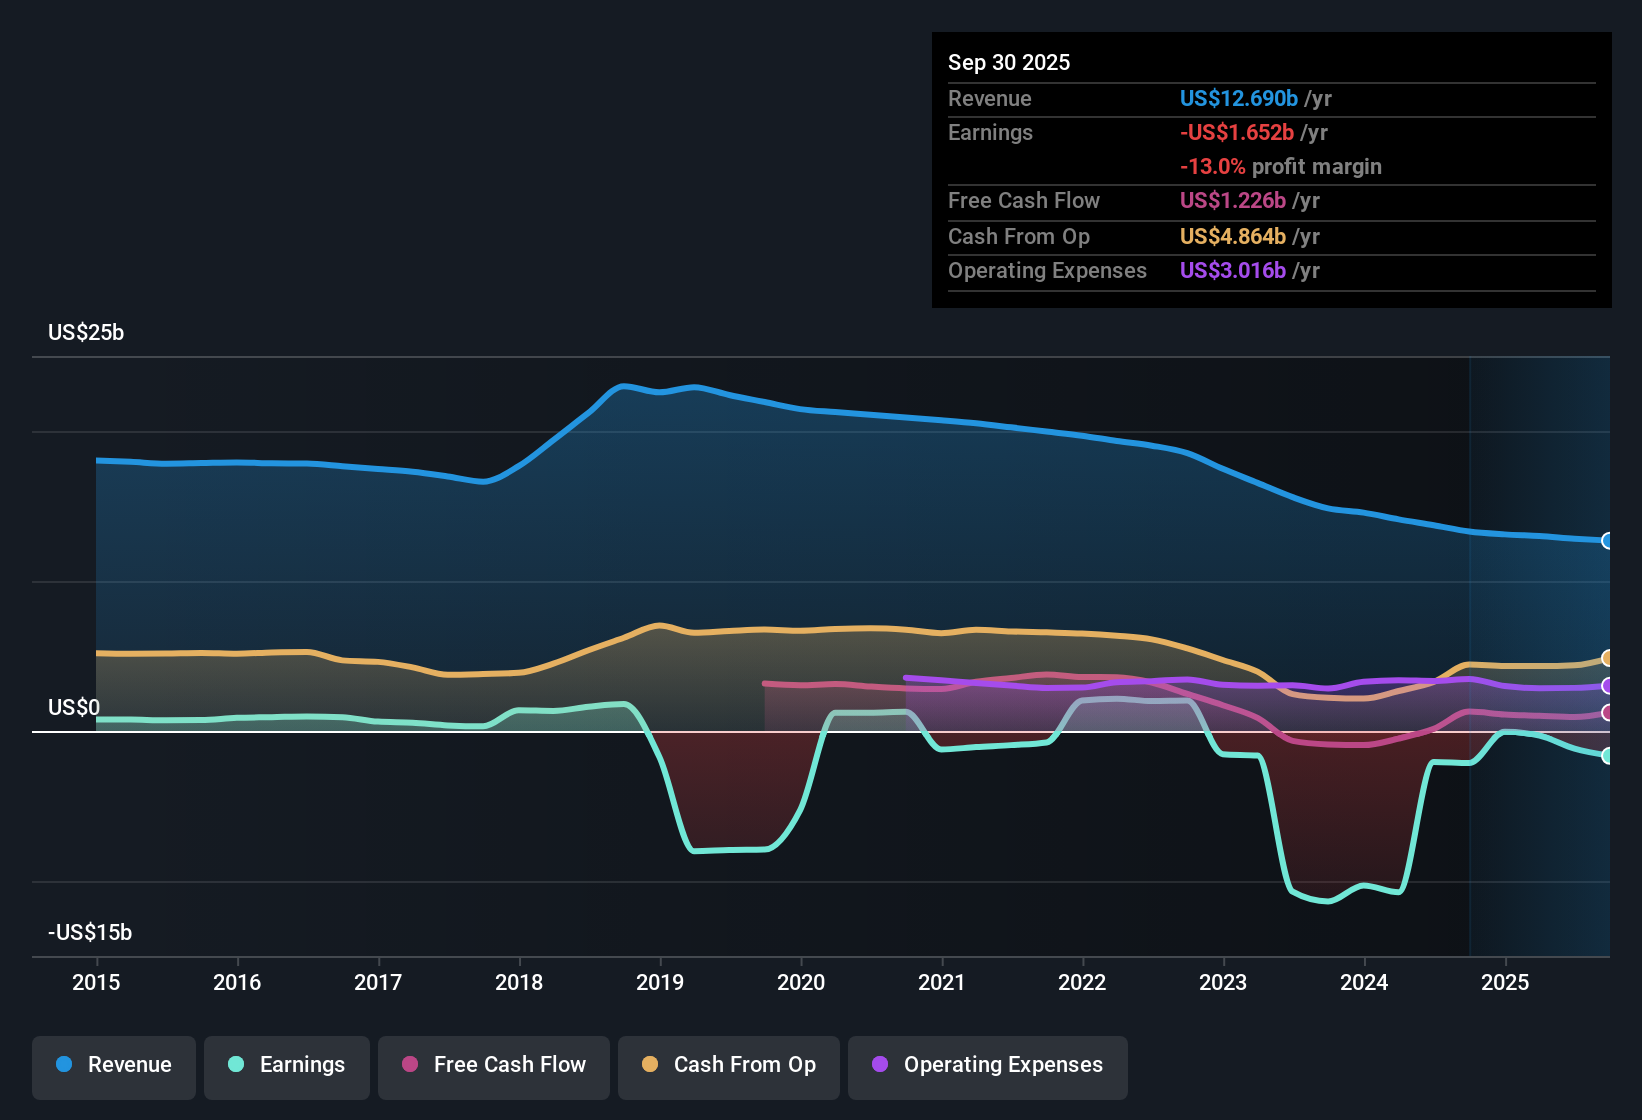
Lumen Technologies (LUMN) FY 2025 earnings snapshot
Lumen Technologies (LUMN) closed FY 2025 with fourth quarter revenue of US$3.0 billion and basic EPS of roughly US$0.00, as net income excluding extra items landed at a loss of US$2 million. The company has seen quarterly revenue move from US$3.3 billion and basic EPS of US$0.09 in Q4 2024 to US$3.0 billion and a near breakeven basic EPS in Q4 2025, alongside a trailing twelve month loss of US$1.7 billion on basic EPS of US$1.75. With expectations in the provided data pointing to earnings growth and a path back to profitability, this latest print places a tight focus on whether margins can gradually repair from here.
See our full analysis for Lumen Technologies.With the headline numbers on the table, the next step is to see how this earnings run rate lines up with the widely followed narratives around Lumen, and where the story investors tell themselves might need an update.
US$1.7b loss on US$12.4b of revenue keeps pressure on turnaround story
- Over the last 12 months, Lumen generated about US$12.4b of revenue but recorded a net loss of roughly US$1.7b and basic EPS of about US$1.75 in losses, showing that the business is still running at a sizeable loss even with Q4 close to breakeven.
- What jumps out for the bullish view that talks about an earnings recovery is that the recent quarterly path, from a loss of US$915 million in Q2 2025 to just US$2 million in Q4, sits against a much weaker trailing picture where losses over the past year still total US$1.7b. Any optimism around improvement has to wrestle with how large that full year loss base remains.
Q4 swing from US$915m loss to near breakeven tempers bearish views
- Within 2025, net income excluding extra items moved from a loss of US$915 million in Q2 to a loss of US$621 million in Q3 and then to just US$2 million in Q4, with basic EPS moving from about US$0.92 in losses in Q2 to roughly flat in Q4, which is a sharp shift inside a single year.
- Bears often focus on telecoms that keep running heavy losses. Yet this sequence, with quarterly losses narrowing from hundreds of millions of dollars earlier in 2025 to almost flat at year end, challenges a purely bearish view that the income statement is locked into deep red territory, even though the trailing 12 month loss of US$1.7b still lines up with that cautious stance when you zoom out.
Low 0.5x P/S and negative equity sit side by side
- On the valuation side, Lumen is trading on a P/S of 0.5x compared with 8.1x for peers and 1.1x for the US telecom industry. At the same time, the balance sheet shows negative shareholders' equity and a DCF estimate in the data places the market price of US$6.23 slightly above an indicative US$6.41 per share cash flow value. Together these factors paint a mixed picture on how the market is pricing risk versus revenue.
- Critics highlight the negative shareholders' equity as a major risk, and that point is reinforced by the very large trailing loss of about US$1.7b over the last year. Yet the relatively low 0.5x P/S versus the 8.1x peer average suggests the bearish concern about the capital structure is being weighed against a much lower revenue multiple than comparable telecom names.
Next Steps
Don't just look at this quarter; the real story is in the long-term trend. We've done an in-depth analysis on Lumen Technologies's growth and its valuation to see if today's price is a bargain. Add the company to your watchlist or portfolio now so you don't miss the next big move.
See What Else Is Out There
Lumen is still carrying a trailing loss of about US$1.7b, negative shareholders' equity, and a P/S that reflects meaningful balance sheet risk.
If that kind of financial pressure makes you uneasy, check out our solid balance sheet and fundamentals stocks screener (388 results) to quickly focus on companies built on sturdier balance sheets and healthier fundamentals.
This article by Simply Wall St is general in nature. We provide commentary based on historical data and analyst forecasts only using an unbiased methodology and our articles are not intended to be financial advice. It does not constitute a recommendation to buy or sell any stock, and does not take account of your objectives, or your financial situation. We aim to bring you long-term focused analysis driven by fundamental data. Note that our analysis may not factor in the latest price-sensitive company announcements or qualitative material. Simply Wall St has no position in any stocks mentioned.