

Lyntris (LYNX) Slides After Its IPO, Is The Valuation Discount Justified?
Lyntris Inc LYNX | 0.00 |
Lyntris (LYNX) has just completed a US$297.5 million IPO, offering 17,000,000 common shares at US$17.50 each in a sponsor backed deal. That pricing now anchors its early trading.
Since listing at US$17.50, Lyntris has seen its share price fall 14.23% on a 1 day basis to US$15.01, signalling fading early momentum as investors reassess the sponsor backed IPO valuation.
If the Lyntris IPO has you thinking about other potential opportunities in defense related technology infrastructure, it could be worth scanning 39 power grid technology and infrastructure stocks
The early drop in Lyntris shares could hint at questions about the business fundamentals rather than just cooler IPO sentiment. To work out which view fits better, it helps to line up the current valuation against the company’s numbers.
Preferred Price-to-Sales Multiple of 3.8x: Is it justified?
Lyntris closed at $15.01 while our data points to a P/S ratio of 3.8x that sits well below peers in the Aerospace & Defense sector.
The P/S ratio compares the company’s market value to its annual revenue and is often used when a business is not yet profitable. For Lyntris, this connects a market cap of about $2.01b to reported revenue of $450.84m, which produces the 3.8x figure.
For a defense technology company that is still loss making, a lower P/S can indicate that the market is cautious about future margins or cash generation. At the same time, our DCF work and other checks suggest the market could be pricing Lyntris below an internally assessed future cash flow value of $92.34 per share, which is a very large gap to the current $15.01 level.
Compared to the peer group that trades around 7.1x sales and the broader US Aerospace & Defense industry average of 5.2x, Lyntris currently sits at a marked discount. This is interpreted as investors valuing each dollar of Lyntris revenue less than that of many competitors, which could change if confidence in the business model or execution improves.
Result: Price-to-sales of 3.8x (UNDERVALUED)
However, Lyntris is still loss making and relies on defense connectivity spending, so any contract delays or tighter military budgets could challenge the current valuation story.
Another View Using Our DCF Model
While the P/S comparison makes Lyntris look inexpensive against peers, the SWS DCF model points to something even more extreme. With an internal future cash flow value estimate of $92.34 per share versus the current $15.01 trading price, the stock screens as heavily undervalued on this method as well. The key question is whether you think those long term cash flow assumptions are realistic for a young, loss making defense technology company.
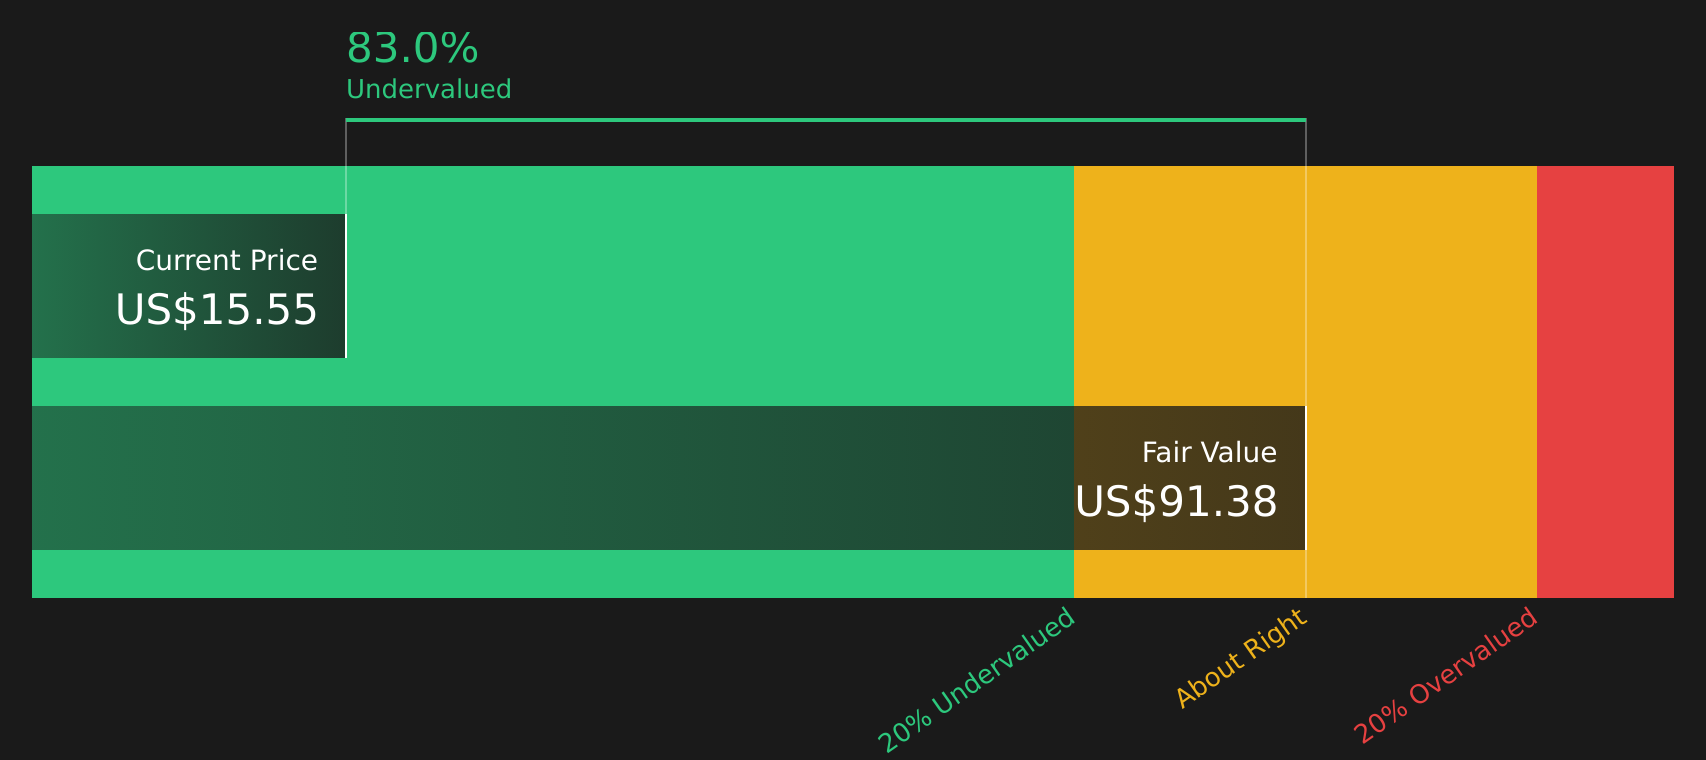
Simply Wall St performs a discounted cash flow (DCF) on every stock in the world every day (check out Lyntris for example). We show the entire calculation in full. You can track the result in your watchlist or portfolio and be alerted when this changes, or use our stock screener to discover 52 high quality undervalued stocks. If you save a screener we even alert you when new companies match - so you never miss a potential opportunity.
Next Steps
With Lyntris trading well below some valuation markers, the key question is whether that discount reflects real concerns or a potential opening. Investigate the data, weigh up both the upside and the risks, and then decide what fits your own thesis by reviewing the 2 key rewards and 2 important warning signs
Looking for more investment ideas beyond Lyntris?
If Lyntris has sharpened your interest in fresh opportunities, do not stop here. Broader research across sectors can help you spot ideas that better suit your goals.
- Zero in on high quality companies trading at appealing prices by checking the 52 high quality undervalued stocks.
- Strengthen your income focus and assess stocks with higher yields through the 12 dividend fortresses.
- Prioritise resilience and steadier profiles by reviewing the 78 resilient stocks with low risk scores.
This article by Simply Wall St is general in nature. We provide commentary based on historical data and analyst forecasts only using an unbiased methodology and our articles are not intended to be financial advice. It does not constitute a recommendation to buy or sell any stock, and does not take account of your objectives, or your financial situation. We aim to bring you long-term focused analysis driven by fundamental data. Note that our analysis may not factor in the latest price-sensitive company announcements or qualitative material. Simply Wall St has no position in any stocks mentioned.