Manchester United (MANU) Draws Fresh Valuation Focus, Is The Recent Rally Already Priced In?
Manchester United Plc Class A MANU | 0.00 |
Manchester United (MANU) stock has drawn fresh interest after recent trading put its market value around $3.95b, with shares last closing at $23.11 and returns mixed across the past month, past 3 months, and longer horizons.
Recent trading has been strong for Manchester United, with the share price return of 10.0% over 30 days and 46.45% year to date pointing to building momentum, while the 3 year total shareholder return of a 5.33% decline highlights a more mixed longer term picture.
If that has you thinking about what else is moving, this could be a good moment to look at 20 top founder-led companies
With Manchester United stock trading below one analyst price target and an indicated intrinsic discount, the key question is whether the recent rally still leaves room for value or if the market is already pricing in future growth.
Preferred Price-to-Sales of 4.4x: Is it justified?
Manchester United shares last closed at $23.11, and on Simply Wall St’s preferred yardstick of value, the stock is trading on a P/S of 4.4x, which screens as expensive against its own fundamentals and peers.
The P/S ratio compares the company’s market value to its revenue, so a higher multiple usually reflects investors paying more for each dollar of sales. For a business like Manchester United that is currently reporting a net loss of $18.1m on revenue of $684.3m, this puts most of the focus on what future cash flows and revenue quality might look like rather than current profitability.
According to the checks, Manchester United is considered expensive on this metric when lined up against several benchmarks. The current P/S of 4.4x is higher than the estimated fair P/S ratio of 2.1x. This is a level the market could move toward if sentiment or expectations cool. It is also above the peer average P/S of 3x and well above the broader US Entertainment industry average of 1.2x, which underlines how much more investors are currently paying for each dollar of sales compared with those groups.
Result: Price-to-sales of 4.4x (OVERVALUED)
However, the current net loss of $18.1m and a P/S above sector and peer averages mean any shift in sentiment or revenue expectations could quickly pressure Manchester United.
Another view on Manchester United using our DCF model
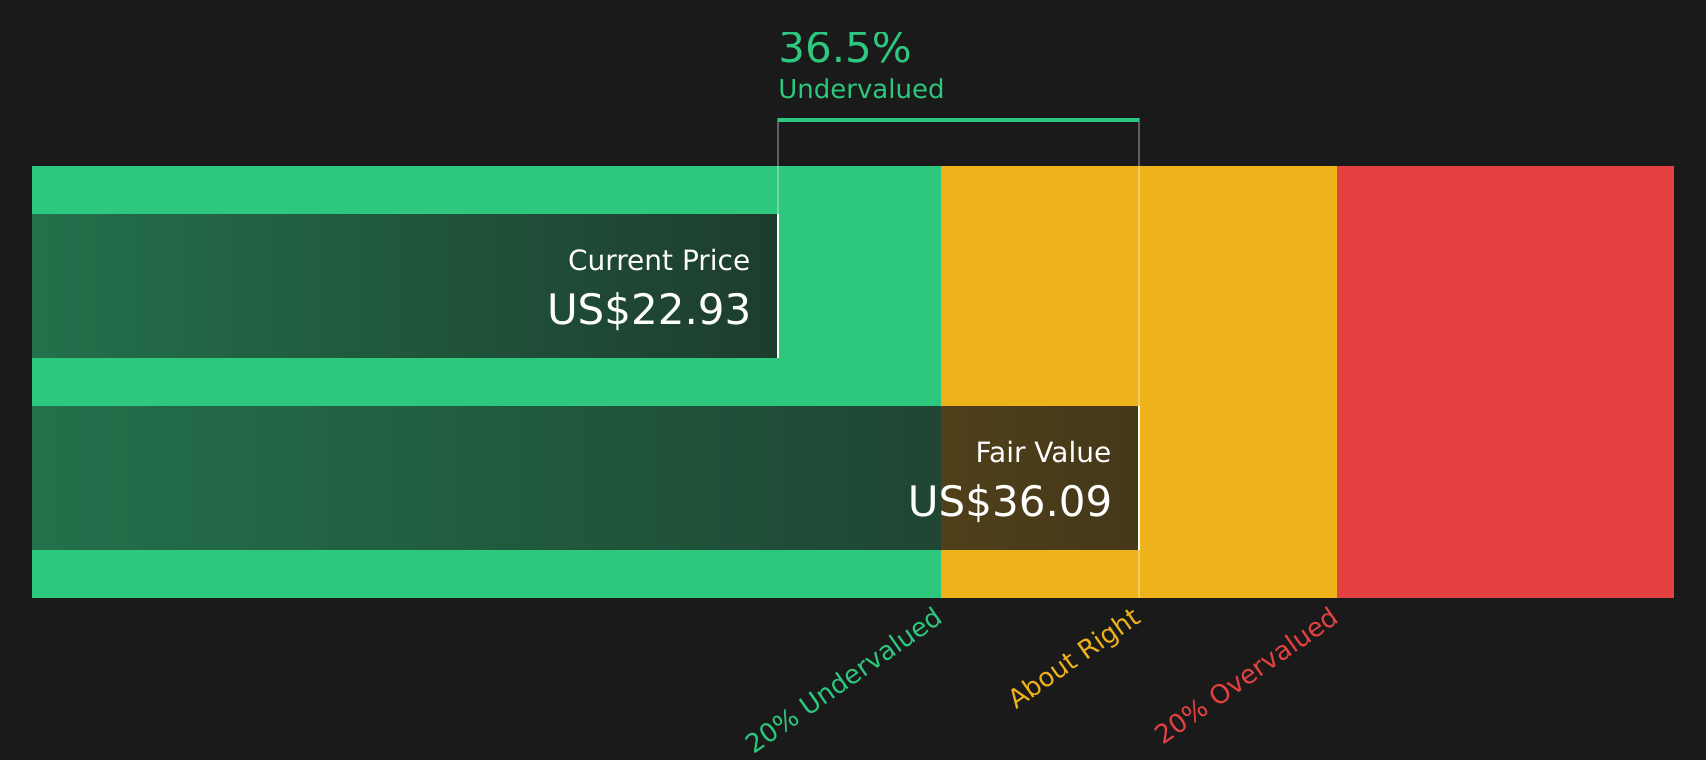
The P/S ratio suggests Manchester United stock looks expensive, but our DCF model points in a different direction. With the shares at $23.11 versus an estimated future cash flow value of $36.10, this approach indicates the stock may be trading at a discount instead.
That split between an expensive sales multiple and a cheaper DCF view raises an important question for you as an investor: which signal should carry more weight when the company is still loss making and sentiment can change quickly?
Simply Wall St performs a discounted cash flow (DCF) on every stock in the world every day (check out Manchester United for example). We show the entire calculation in full. You can track the result in your watchlist or portfolio and be alerted when this changes, or use our stock screener to discover 42 high quality undervalued stocks. If you save a screener we even alert you when new companies match - so you never miss a potential opportunity.
Next Steps
With Manchester United showing both pressure points and areas of optimism, this is a good time to study the data, weigh the trade offs, and see the full balance of 3 key rewards and 1 important warning sign
Looking for more investment ideas beyond Manchester United?
If Manchester United has sharpened your focus on valuation and risk, do not stop here. Broaden your watchlist with other clear, data driven stock ideas.
- Target potential value opportunities by scanning companies that currently screen as attractively priced using the 42 high quality undervalued stocks.
- Strengthen your focus on resilience by reviewing the 72 resilient stocks with low risk scores for stocks with lower risk profiles supported by fundamentals.
- Spot under-the-radar opportunities early by checking the screener containing 19 high quality undiscovered gems before they are widely followed.
This article by Simply Wall St is general in nature. We provide commentary based on historical data and analyst forecasts only using an unbiased methodology and our articles are not intended to be financial advice. It does not constitute a recommendation to buy or sell any stock, and does not take account of your objectives, or your financial situation. We aim to bring you long-term focused analysis driven by fundamental data. Note that our analysis may not factor in the latest price-sensitive company announcements or qualitative material. Simply Wall St has no position in any stocks mentioned.