Nike (NKE) Beats On Q4 But Flags More Sales Pressure, Is It Fully Priced?
NIKE, Inc. Class B NKE | 0.00 |
Nike (NKE) just posted fiscal fourth quarter results that topped earnings and revenue forecasts, but management’s warning of further sales pressure in early fiscal 2027 quickly became the main focus for investors.
Nike’s latest results came after a long slide in the stock, with the year to date share price return down 31.95% and the 1 year total shareholder return down 42.08%. The 4.90% 1 day share price gain and modest 7 day rebound signal near term momentum improving slightly after a weak 30 day and multi year stretch, as investors weigh cautious guidance, management changes and World Cup related brand activity against the ongoing turnaround risks.
If Nike’s reset has you rethinking your portfolio, this is a good moment to look at other consumer and growth stories through our screener of 20 top founder-led companies
With Nike shares trading near multi year lows despite earnings beats, a tariff refund boost and a modest discount to analyst targets, the key question now is whether the stock is genuinely cheap or if the market already reflects its slower growth path.
Most Popular Narrative: 10% Overvalued
On the most followed narrative, Nike screens as modestly overvalued, with a fair value of $43.01 against the latest $43.06 close. This makes the embedded assumptions worth understanding.
Based on the current analysis, Nike (NKE) appears overvalued at its current price of $65.90 relative to the intrinsic value suggested by our DCF of $46.62 and other valuation methods. A more cautious approach is to wait for a potential entry below $50, where the stock would align more closely with its fundamental value. Alternatively, investors can monitor Nike’s performance, including revenue growth, margins, and capital allocation, to see whether future results justify a higher valuation before entering. This approach balances the opportunity to invest in a strong brand while aiming to avoid overpaying in the short term.
According to DS2invest, this Nike narrative leans heavily on a specific growth path, disciplined profitability and a particular earnings multiple. Want to see how those moving parts interact, and which assumptions had to stretch to reach the fair value line?
Result: Fair Value of $43.01 (OVERVALUED)
However, Nike’s recent multi year share price declines, as well as any stumble in direct to consumer execution, could quickly challenge the idea that the stock is only modestly mispriced.
Another View: What Nike’s P/E Ratio Is Saying
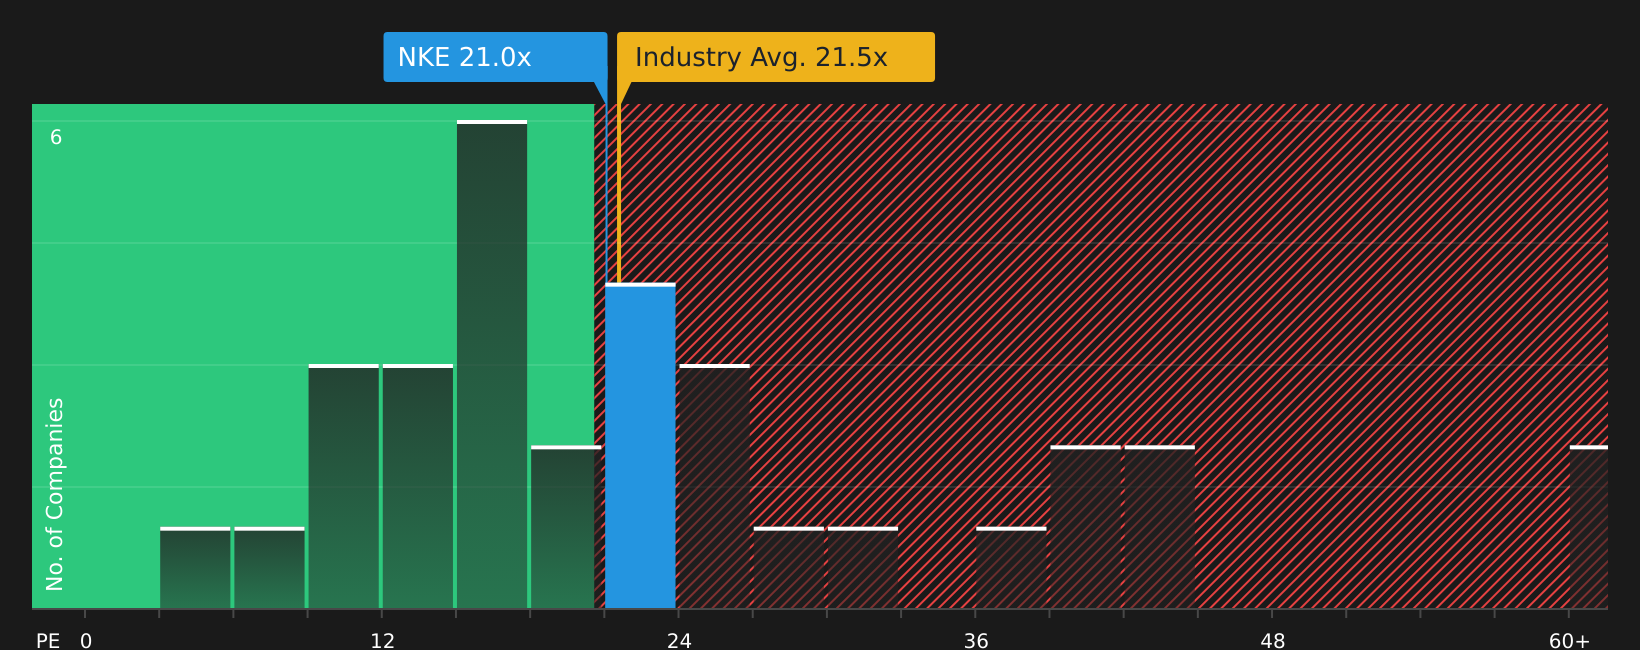
While the DS2invest narrative leans on discounted cash flows to argue Nike is overvalued, the current P/E of 20.5x paints a softer picture. It sits below both the peer average of 27.9x and the US Luxury industry average of 21.3x, and under the fair ratio of 26.9x that the market could move toward, which raises the question of whether earnings risk is already priced in.
For a closer look at how this earnings based view stacks up against other checks, take a look at the See what the numbers say about this price — find out in our valuation breakdown.
Next Steps
Feeling mixed about Nike after these contrasting signals on value and execution? While the details are fresh, review the full picture of concerns and positives through 3 key rewards and 1 important warning sign.
Looking for more investment ideas beyond Nike?
If Nike’s reset has sharpened your focus, do not stop here. Use this window to line up other opportunities that could fit your portfolio goals.
- Target resilience with companies that pair financial strength and earnings quality through our solid balance sheet and fundamentals stocks screener (47 results).
- Hunt for potential mispricings by scanning our list of 41 high quality undervalued stocks before the market fully catches on.
- Prioritize income and stability by reviewing the companies in our 8 dividend fortresses so you are not left chasing yield later.
This article by Simply Wall St is general in nature. We provide commentary based on historical data and analyst forecasts only using an unbiased methodology and our articles are not intended to be financial advice. It does not constitute a recommendation to buy or sell any stock, and does not take account of your objectives, or your financial situation. We aim to bring you long-term focused analysis driven by fundamental data. Note that our analysis may not factor in the latest price-sensitive company announcements or qualitative material. Simply Wall St has no position in any stocks mentioned.