Nike (NKE) Stock After 32% Slide This Year Is Valuation Now Attractive
NIKE, Inc. Class B NKE | 0.00 |
- If you are wondering whether NIKE stock is starting to look interesting at current levels, the key question is how its current share price stacks up against a grounded view of fair value.
- Despite NIKE's strong brand, the stock has declined 4.4% over the past week, 3.3% over the past month, and is down 31.7% year to date and 27.0% over the last year.
- These moves come as the market continues to reassess expectations around consumer demand and the broader athletic apparel sector. This directly shapes how investors think about NIKE's future cash flows and risk profile. For long term holders and new investors alike, this context is important when deciding whether current pricing is attractive or simply reflects changed expectations.
- On Simply Wall St's valuation checks, NIKE currently records a value score of 3 out of 6, which suggests some measures flag potential undervaluation while others do not. The rest of this article will unpack those different valuation methods before finishing with a more holistic way to think about NIKE's value story.
Approach 1: NIKE Discounted Cash Flow (DCF) Analysis
A Discounted Cash Flow, or DCF, model estimates what NIKE stock could be worth today by projecting future cash flows and discounting them back to a single present value figure.
For NIKE, the model used is a 2 Stage Free Cash Flow to Equity approach. The latest twelve month free cash flow stands at about $1.04b. Looking ahead, analysts and extrapolated estimates point to free cash flow of $3.91b in 2030, with intermediate projections between 2026 and 2035 ranging from roughly $2.09b to $5.14b. These figures are all expressed in dollars and then discounted back to today.
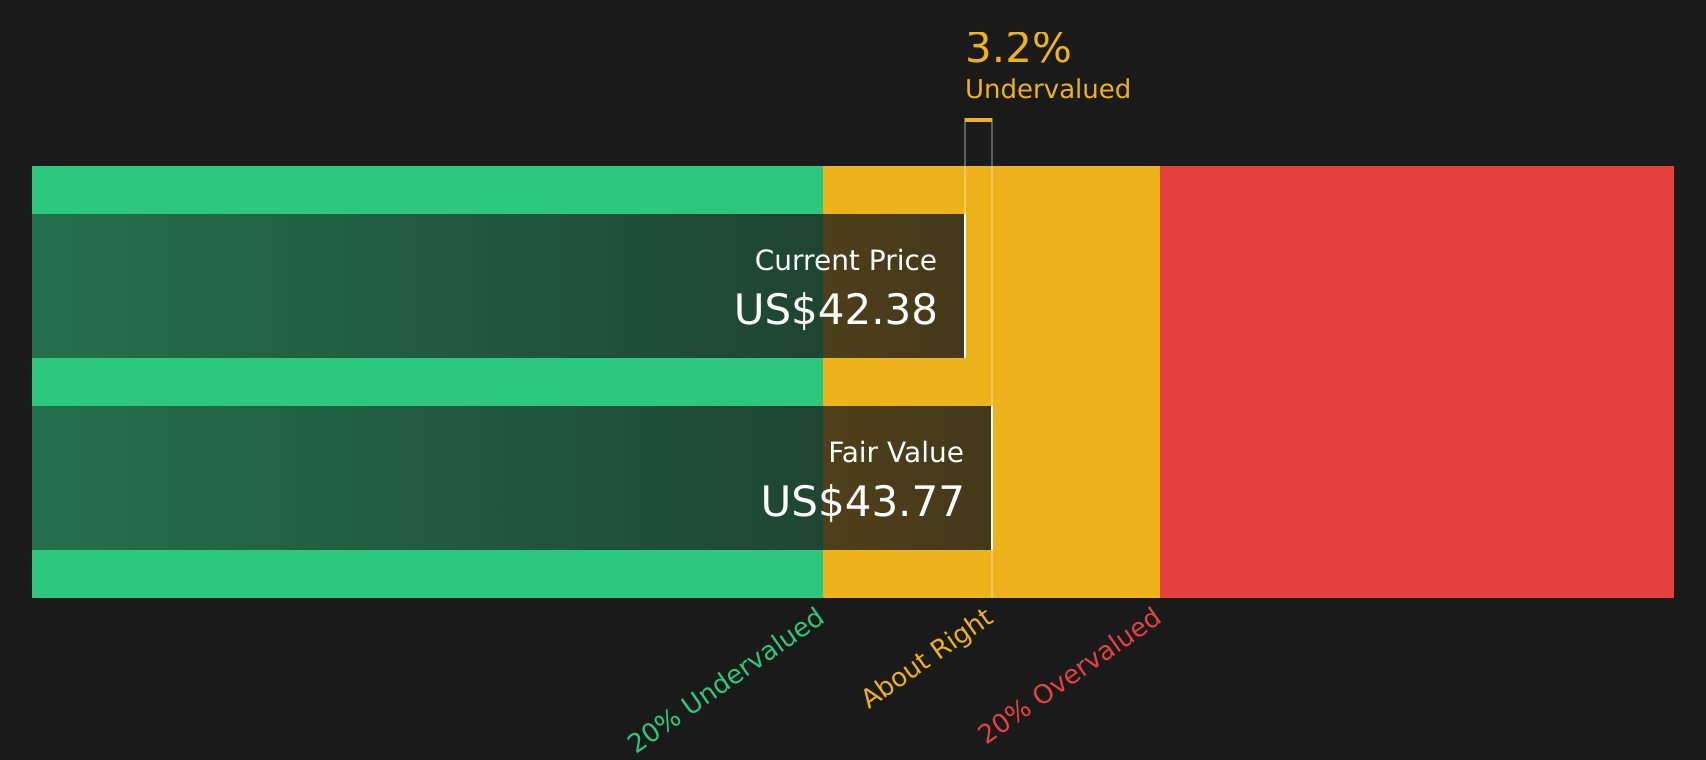
When Simply Wall St aggregates these discounted cash flows, the resulting intrinsic value estimate is $43.91 per share. Compared with the current share price, this implies a 1.6% discount, which is a very small gap and well within the sort of margin that can be explained by normal market noise.
Result: ABOUT RIGHT
NIKE is fairly valued according to our Discounted Cash Flow (DCF), but this can change at a moment's notice. Track the value in your watchlist or portfolio and be alerted on when to act.
Approach 2: NIKE Price vs Earnings
For a profitable company like NIKE, the P/E ratio is a useful way to think about what you are paying for each dollar of current earnings. Investors typically accept a higher P/E when they expect stronger earnings growth or see lower risk, and look for a lower P/E when growth is more modest or risks are higher.
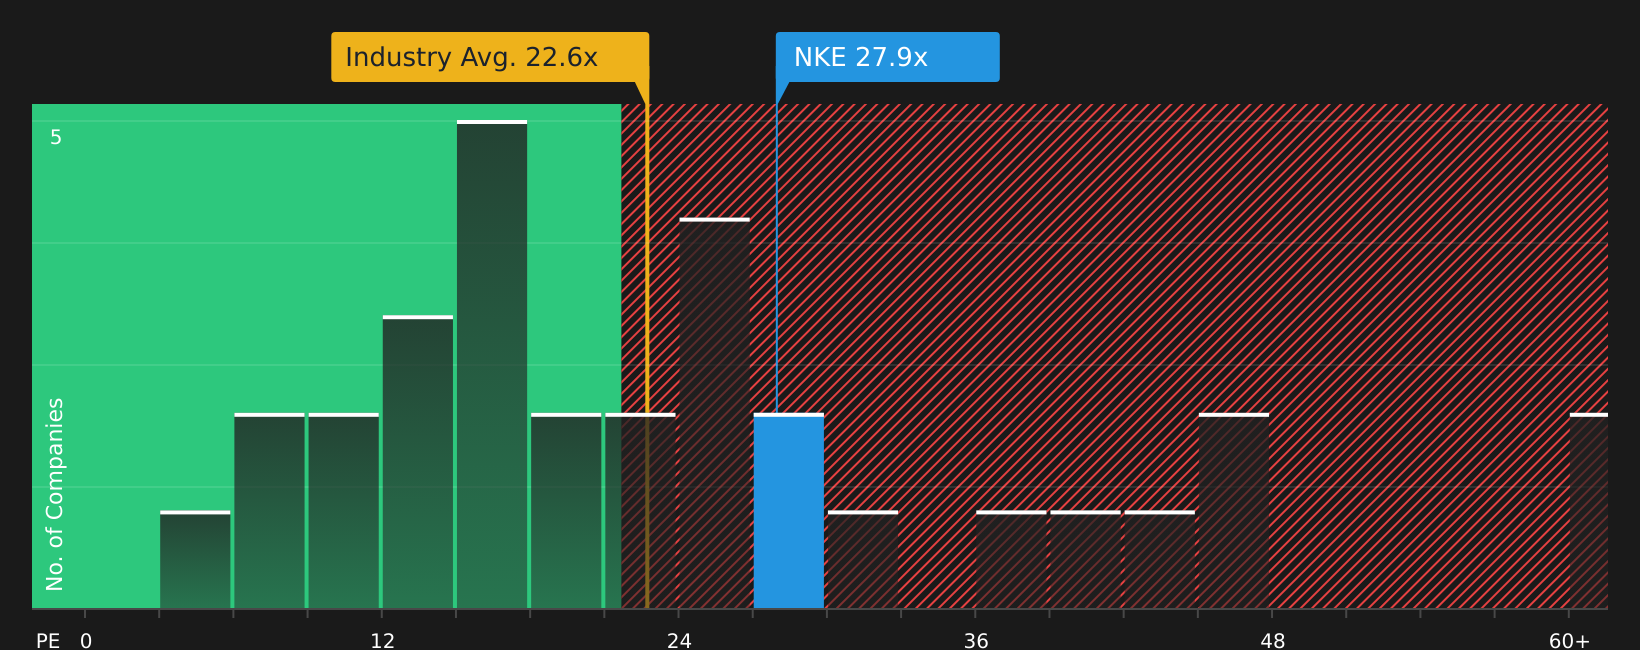
NIKE currently trades on a P/E of 28.43x. This is very close to the peer average of 28.43x and above the broader Luxury industry average P/E of 22.74x. On the surface, that suggests the stock is priced more in line with direct peers than with the wider sector.
Simply Wall St also provides a “Fair Ratio” for NIKE of 29.71x. This is a proprietary estimate of what NIKE’s P/E might be given its earnings growth profile, industry, profit margins, market capitalization and risk factors. Because it incorporates these company specific features, the Fair Ratio can be more informative than a simple comparison to peers or industry averages alone.
Compared with NIKE’s current P/E of 28.43x, the Fair Ratio of 29.71x is modestly higher, pointing to the stock being slightly undervalued on this metric.
Result: UNDERVALUED
P/E ratios tell one story, but what if the real opportunity lies elsewhere? Start investing in legacies, not executives. Discover our 20 top founder-led companies.
Upgrade Your Decision Making: Choose your NIKE Narrative
Earlier it was mentioned that there is an even better way to understand valuation, so here is where Narratives come in for NIKE.
A Narrative is simply your story about the company, where you spell out what you think happens to revenue, earnings and margins, then tie that story to your own fair value estimate instead of relying only on a single DCF or P/E number.
On Simply Wall St, Narratives sit inside the Community page and are designed so any investor can plug in assumptions without complex modelling, connect NIKE’s business outlook to a forecast, and then see what fair value that story implies.
Once your Narrative is set up, you can quickly compare its fair value to the current share price to decide whether NIKE looks expensive or cheap against your own expectations. The platform keeps that view current by updating the calculations when new earnings, news or analyst estimates are added.
The range of NIKE Narratives already published shows how different perspectives can be. One bearish view uses a fair value near US$23.70 and a future P/E of 11.79x, while a bullish view is closer to US$109.11 with a future P/E of 33.85x. This helps you see where your own convictions sit along that spectrum.
For NIKE however we will make it really easy for you with previews of two leading NIKE Narratives:
Fair value in this bullish narrative: US$96.60
Implied discount to this fair value from the last close of US$43.19: about 55.3% undervalued
Revenue growth assumption: 2%
- Assumes NIKE can recover from a rough patch and gradually improve revenue growth from 2% toward 5% as leadership resets the business.
- Views metrics such as a 20.16x P/E against a 10 year average of 34.95x, high return on equity, and strong profitability ratios as support for a higher fair value.
- Sees support from a DCF value of US$82.02 and a dividend yield around 2% as part of a case that NIKE stock could justify a meaningfully higher price over time.
Fair value in this cautious narrative: US$43.01
Implied premium to this fair value from the last close of US$43.19: about 0.4% overvalued
Revenue growth assumption: 10%
- Highlights NIKE's global brand, economies of scale and broad customer reach, but still arrives at a fair value close to US$43.01 per share.
- Points to a strong balance sheet and direct to consumer focus as positives, yet concludes that recent prices sit above intrinsic value estimates from DCF and other methods.
- Frames NIKE as a solid company where investors may want the share price to be closer to calculated fair value before taking on more exposure.
Together these two NIKE Narratives show how reasonable investors, using different assumptions, can land on very different fair values. If you want to see all the other bullish and bearish takes, and plug in your own assumptions about NIKE's future earnings and margins, you can review the full set of community narratives and supporting valuation work in one place with To see how these results tie into long-term growth, risks, and valuation, check out the full range of community narratives for NIKE on Simply Wall St. Add the company to your watchlist or portfolio so you'll be alerted when the story evolves.
Do you think there's more to the story for NIKE? Head over to our Community to see what others are saying!

This article by Simply Wall St is general in nature. We provide commentary based on historical data and analyst forecasts only using an unbiased methodology and our articles are not intended to be financial advice. It does not constitute a recommendation to buy or sell any stock, and does not take account of your objectives, or your financial situation. We aim to bring you long-term focused analysis driven by fundamental data. Note that our analysis may not factor in the latest price-sensitive company announcements or qualitative material. Simply Wall St has no position in any stocks mentioned.