Nike (NKE) Stock Weighs Sharp Multi‑Year Drop Against DCF And P/E Signals
NIKE, Inc. Class B NKE | 0.00 |
- Investors may be wondering if NIKE at around US$44.93 is a bargain or a value trap, especially after a tough few years for the stock.
- The share price has risen 4.5% over the past week and 6.1% over the past month, but is still down 29.0% year to date and 23.7% over the past year. Longer term 3 year and 5 year returns also show large declines of 57.9% and 62.0%.
- Recent coverage has focused on how investors are reassessing established consumer brands and their pricing power, as well as changing consumer habits in footwear and apparel. This context helps explain why NIKE's share price has moved recently while still sitting well below levels from several years ago.
- NIKE currently scores a 2 out of 6 valuation checks. This raises the question of what different valuation methods say about the stock today and how a fuller framework later in this article can give you an even clearer view of value.
NIKE scores just 2/6 on our valuation checks. See what other red flags we found in the full valuation breakdown.
Approach 1: NIKE Discounted Cash Flow (DCF) Analysis
A Discounted Cash Flow, or DCF, model estimates what a stock could be worth today by projecting its future cash flows and then discounting those back to a present value using a required return.
For NIKE, the model used is a 2 Stage Free Cash Flow to Equity approach based on cash flow projections. The latest twelve month free cash flow is about $1.04b. Analysts and internal estimates project free cash flow in the $2.0b to $5.1b range over the next decade, with Simply Wall St extrapolating beyond the period where analysts provide forecasts. For example, projected free cash flow for 2030 is $3.91b, with discounted values provided for each year through 2035.
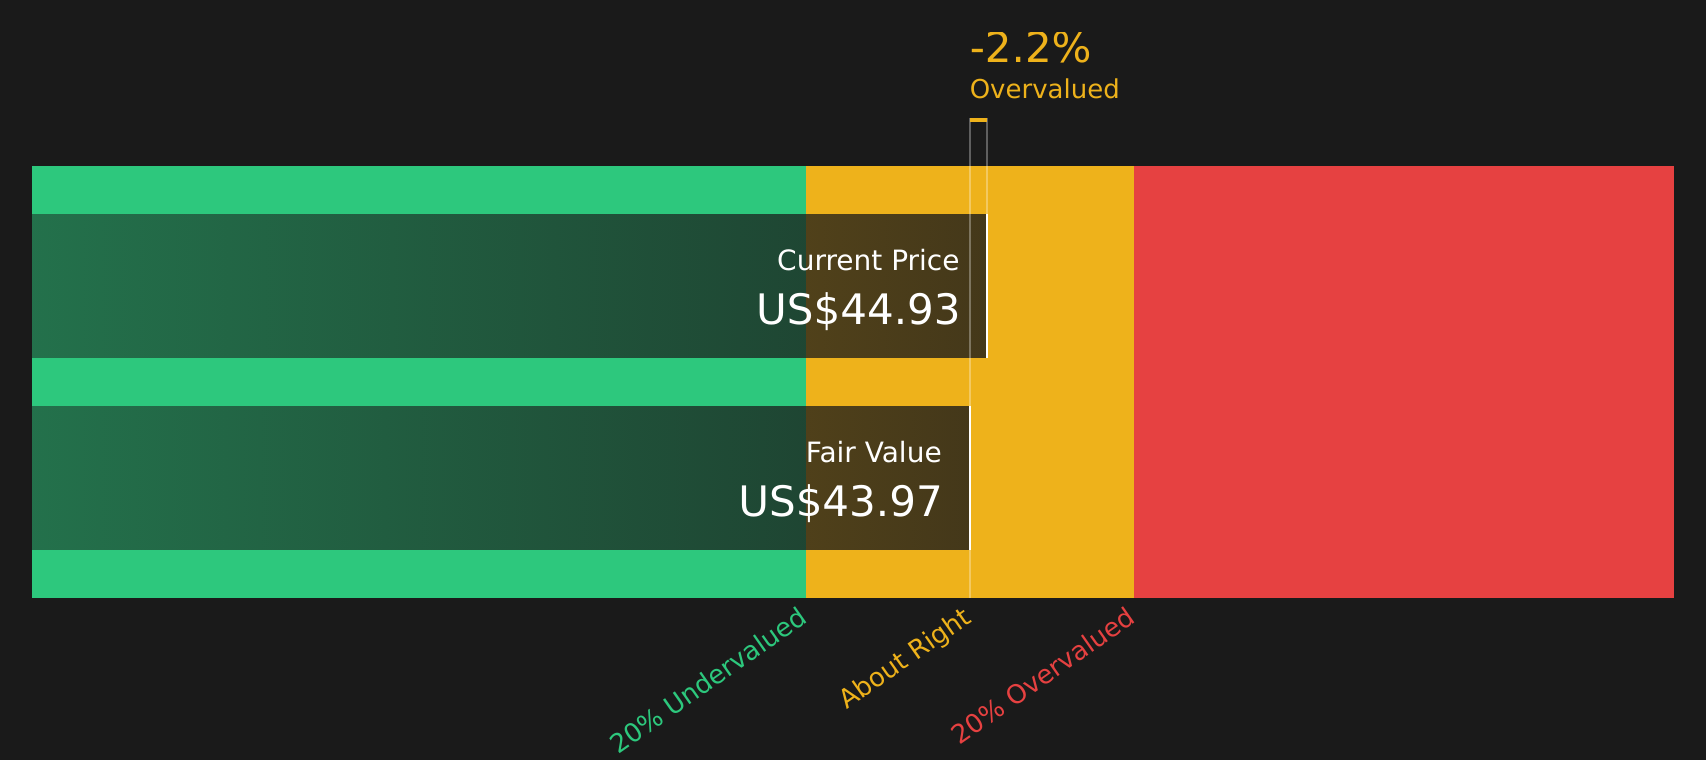
Adding these discounted cash flows results in an estimated intrinsic value of about $44.08 per share. Compared with the current share price of around $44.93, the DCF output suggests NIKE is about 1.9% overvalued, which is a very small gap and well within any reasonable margin of error.
Result: ABOUT RIGHT
NIKE is fairly valued according to our Discounted Cash Flow (DCF), but this can change at a moment's notice. Track the value in your watchlist or portfolio and be alerted on when to act.
Approach 2: NIKE Price vs Earnings (P/E)
For profitable companies, the P/E ratio is a useful way to relate what you pay for a share to the earnings that each share generates. It helps you compare how the market is pricing those earnings across different companies.
What counts as a “normal” or “fair” P/E depends on what investors expect for future earnings growth and how much risk they see in the business. Higher expected growth or lower perceived risk can justify a higher P/E, while lower growth or higher risk usually points to a lower P/E.
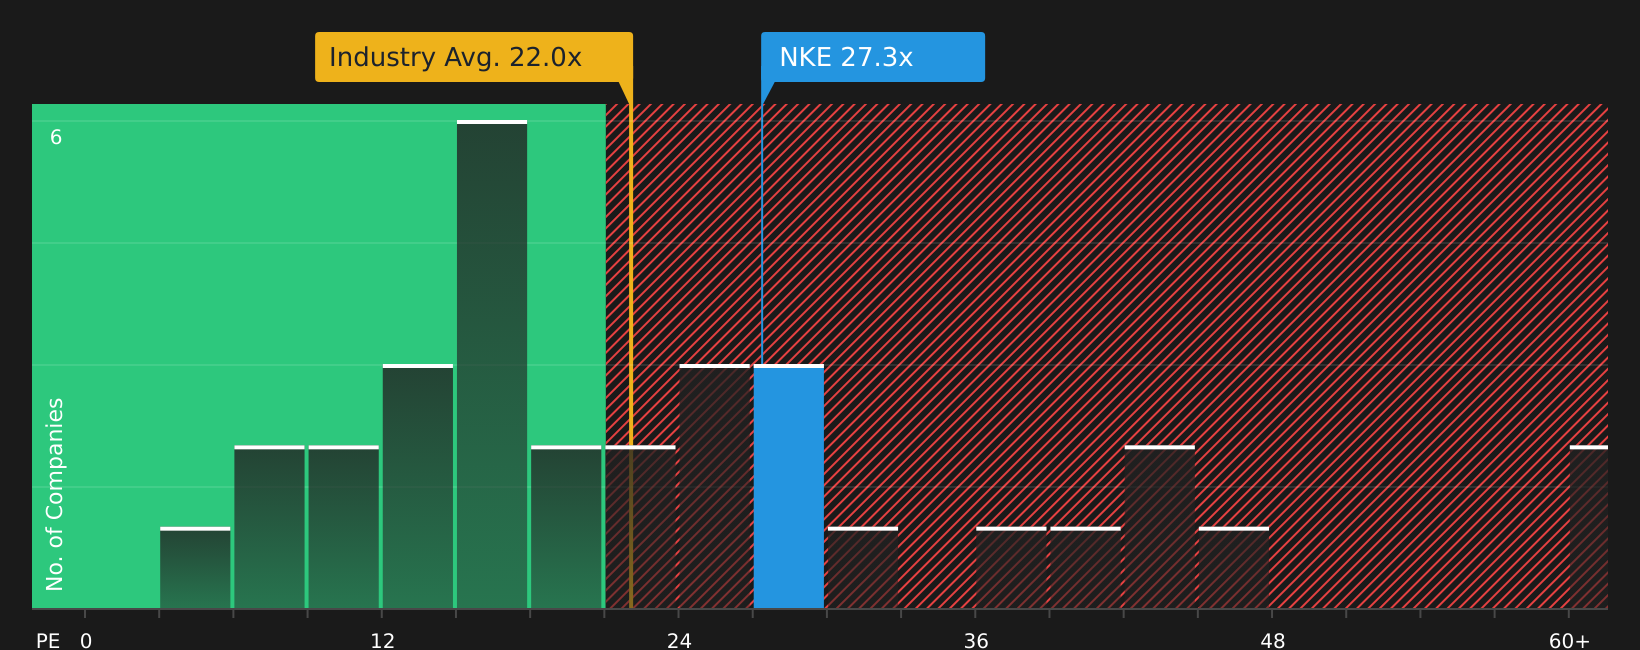
NIKE currently trades on a P/E of 29.57x, compared with the Luxury industry average of 24.44x and a peer group average of 30.56x. Simply Wall St also provides a proprietary “Fair Ratio” of 29.82x, which is the P/E level you might expect given factors such as NIKE's earnings growth profile, industry, profit margin, market cap and risk characteristics.
This Fair Ratio is more tailored than a simple peer or industry comparison because it adjusts for those company specific factors instead of assuming one size fits all. With NIKE's actual P/E of 29.57x sitting very close to the Fair Ratio of 29.82x, the shares appear broadly in line with what the model suggests.
Result: ABOUT RIGHT
P/E ratios tell one story, but what if the real opportunity lies elsewhere? Start investing in legacies, not executives. Discover our 20 top founder-led companies.
Upgrade Your Decision Making: Choose your NIKE Narrative
Earlier the article mentioned that there is an even better way to understand valuation. This is where Narratives come in, letting you connect your view of NIKE's story with a set of numbers by linking your assumptions about future revenue, earnings and margins to a fair value that can be compared with today's price. All of this happens inside Simply Wall St's Community page, where Narratives are updated automatically when new data, news or earnings arrive. Different investors can reasonably land far apart, such as one NIKE Narrative on the platform with a fair value near US$25.51 that focuses on tariff, brand and restructuring risks, while another sits closer to US$112.79 that leans on stronger long term brand power and margin recovery. This gives you a clear, side by side sense of which story you believe and whether the current price of about US$44.93 fits your own view of value.
For NIKE however, we will make it really easy for you with previews of two leading NIKE Narratives:
Together, they show how different assumptions on growth, margins and fair value can lead to very different conclusions about what the current price of about US$44.93 means for you as a shareholder.
Fair value: US$96.60
Gap to current price: about 53.5% below this fair value level
Revenue growth assumption: 2%
- Views NIKE as a staple brand that has been through a rough patch but could recover with better leadership decisions.
- Highlights profitability metrics such as a P/E of 20.16 compared with a 10 year average of 34.95, along with strong return ratios and cash per share.
- Sees support from a DCF value of US$82.02 and dividend income, framing the stock as potentially undervalued relative to long term potential.
Fair value: US$43.01
Gap to current price: about 4.5% above this fair value level
Revenue growth assumption: 10%
- Emphasizes NIKE's global brand, market leadership and cost efficiency from scale, but concludes that the stock can trade above intrinsic value.
- Points to a DCF result around US$46.62 and other valuation cross checks such as EV/EBITDA and P/E benchmarks that were below a past market price, framing the shares as expensive at that time.
- Suggests that investors watch revenue growth, margins and capital allocation closely and wait for a valuation that aligns more closely with estimated intrinsic value before committing more capital.
These two narratives sit on opposite sides of the value debate, yet both use clear numbers and stated assumptions. That is the real advantage of NIKE Narratives. You can see exactly which story you agree with, adjust the inputs if your view differs, and then judge whether today’s US$44.93 share price lines up with your own expectations for the company.
To see how these results tie into long-term growth, risks, and valuation, check out the full range of community narratives for NIKE on Simply Wall St. Add the company to your watchlist or portfolio so you'll be alerted when the story evolves.
Do you think there's more to the story for NIKE? Head over to our Community to see what others are saying!

This article by Simply Wall St is general in nature. We provide commentary based on historical data and analyst forecasts only using an unbiased methodology and our articles are not intended to be financial advice. It does not constitute a recommendation to buy or sell any stock, and does not take account of your objectives, or your financial situation. We aim to bring you long-term focused analysis driven by fundamental data. Note that our analysis may not factor in the latest price-sensitive company announcements or qualitative material. Simply Wall St has no position in any stocks mentioned.