

Nokia Oyj (NOK) Signs ERP Deal As Investors Ask If The Stock Is Fully Valued
Nokia Oyj Sponsored ADR NOK | 0.00 |
Nokia Oyj (NYSE:NOK) has agreed to a multi-year ERP modernization with SAP and Microsoft, moving to SAP S/4HANA on Azure to consolidate data, applications, and operating models across its global operations.
Nokia Oyj’s recent ERP agreement lands after a period of strong share price momentum, with the latest close at US$12.90, a 90-day share price return of 36.36% and a 1-year total shareholder return of 159.45% that underlines how sentiment has shifted.
If this kind of digital infrastructure story interests you, it could be a good moment to look at other potential beneficiaries of data and connectivity trends through our 34 power grid technology and infrastructure stocks
After Nokia Oyj’s sharp rerating and a share price now sitting close to analyst targets and intrinsic estimates, the real tension is whether recent enthusiasm has already done the heavy lifting or if valuation still leaves meaningful upside ahead.
Price-to-Earnings of 81.2x: Is it justified?
Nokia Oyj currently trades on a P/E of 81.2x, which sits against a last close of $12.90 and suggests the stock is priced at a premium to many peers.
The P/E ratio compares the company’s share price to its earnings per share. A higher multiple usually means the market is paying more today for each dollar of current earnings. For a business like Nokia Oyj that is active across networks, cloud and licensing, investors often watch this multiple closely because it reflects expectations around profit trends more than short term revenue moves.
Here, the picture is mixed. On one side, Nokia Oyj’s P/E of 81.2x is below the peer average of 89x, which implies the stock is not the richest in its group. On the other side, it is described as expensive versus the estimated fair P/E of 50.6x, so the current market price embeds stronger earnings expectations than the level that model suggests the market could eventually move toward.
Compared with the wider US Communications industry average P/E of 33.3x, Nokia Oyj’s 81.2x multiple is described as expensive, which reinforces how much more investors are currently paying relative to the sector overall.
Result: Price-to-Earnings of 81.2x (OVERVALUED)
However, Nokia Oyj’s recent share price strength, rich P/E, and a small premium to both analyst targets and intrinsic estimates all leave less room if sentiment cools.
Another View: Nokia Oyj Through a Cash Flow Lens
While the P/E ratio frames Nokia Oyj as expensive, the SWS DCF model offers a slightly different angle, with the stock at $12.90 versus an estimated future cash flow value of $12.67. That small premium points to a much tighter margin of safety. This raises the question of where to place more weight: earnings or cash flows?
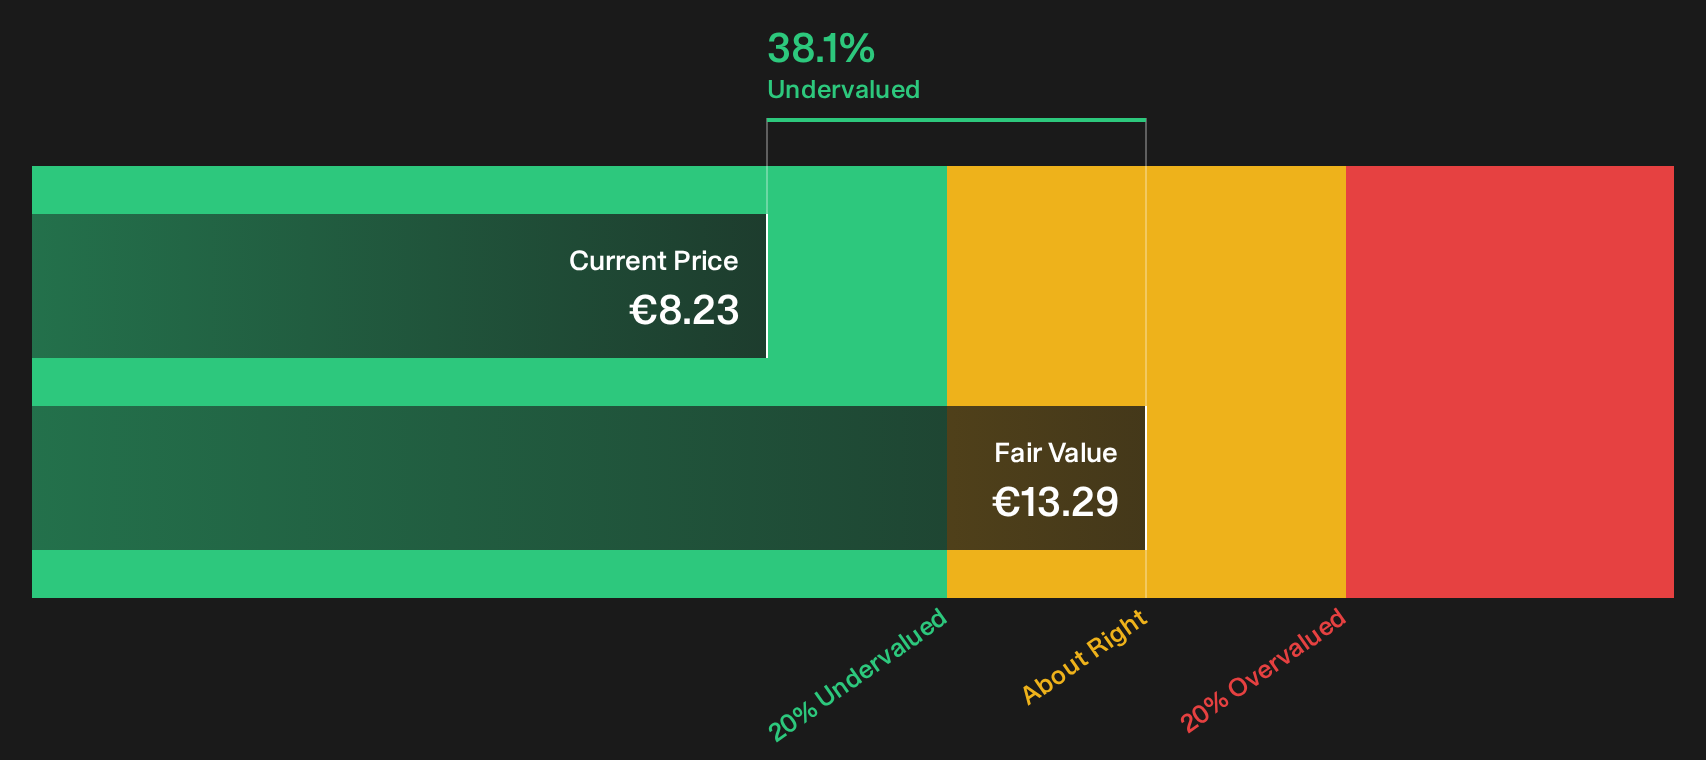
Simply Wall St performs a discounted cash flow (DCF) on every stock in the world every day (check out Nokia Oyj for example). We show the entire calculation in full. You can track the result in your watchlist or portfolio and be alerted when this changes, or use our stock screener to discover 44 high quality undervalued stocks. If you save a screener we even alert you when new companies match - so you never miss a potential opportunity.
Next Steps
With sentiment around Nokia Oyj clearly split between rich multiples and a closer DCF reading, this is a moment to move quickly and test the data for yourself so you are comfortable with both risk and opportunity, starting with the 1 key reward and 2 important warning signs
Looking for more investment ideas beyond Nokia Oyj?
Do not stop at Nokia Oyj alone. Broaden your opportunity set by scanning other stocks that fit clear, data driven criteria using the Simply Wall Street Screener.
- Target resilience by checking out companies that show up in the 73 resilient stocks with low risk scores and see which stocks score well on risk metrics.
- Hunt for potential value by reviewing the 44 high quality undervalued stocks where pricing and fundamentals appear better aligned.
- Spot potential income ideas by scanning the 9 dividend fortresses and see which companies offer higher yields with supportive metrics.
This article by Simply Wall St is general in nature. We provide commentary based on historical data and analyst forecasts only using an unbiased methodology and our articles are not intended to be financial advice. It does not constitute a recommendation to buy or sell any stock, and does not take account of your objectives, or your financial situation. We aim to bring you long-term focused analysis driven by fundamental data. Note that our analysis may not factor in the latest price-sensitive company announcements or qualitative material. Simply Wall St has no position in any stocks mentioned.