

Nuvalent (NUVL) Valuation Check As FDA Accepts NDAs For Two Lung Cancer Therapies
Nuvalent, Inc. Class A NUVL | 0.00 |
Nuvalent (NUVL) is back in focus after the FDA accepted New Drug Applications for two of its targeted cancer drug candidates, zidesamtinib and neladalkib, following supportive clinical trial data in advanced lung cancer.
Despite a 31.55% total shareholder return over the past year and a very large 159.12% total shareholder return over three years, Nuvalent’s recent share price momentum has cooled. The 7 day share price return is 7.17%, and the year to date share price return is close to flat as investors reassess the recent FDA and clinical trial milestones against current expectations.
If you are looking for other oncology and biotech names riding similar themes in targeted therapies, this is a good moment to size up 33 healthcare AI stocks
With Nuvalent now valued at about US$7.8b and trading at US$100.28 after a strong multi year run, the key question is straightforward: are investors underestimating its pipeline progress, or is the market already pricing in much of the future growth?
Preferred Price to Book Multiple of 6.3x: Is It Justified?
Nuvalent closed at $100.28 and currently trades on a P/B of 6.3x, which screens as expensive relative to the broader US Biotechs industry but looks cheaper than its immediate peer set based on that same metric.
The P/B ratio compares the company’s market value to its book value. This measure is common for early stage biopharma names that have minimal revenue and are valued largely on cash, intellectual property, and pipeline potential. For a clinical stage company with no reported revenue and ongoing losses, investors are effectively paying for the strength and prospects of the drug portfolio rather than current earnings power.
Nuvalent’s P/B of 6.3x sits well above the US Biotechs industry average of 2.2x. This suggests the market is assigning a premium for its oncology pipeline and recent FDA progress. At the same time, the same 6.3x P/B ratio is described as good value compared with a much higher 43.5x peer average. Within a closer peer group of similar companies, Nuvalent’s valuation multiple is therefore relatively restrained.
Result: Price-to-book of 6.3x (ABOUT RIGHT)
However, you still need to weigh execution risks around ongoing clinical trials and the current net loss of $425.377m if sentiment on early stage biotech cools.
Another View: SWS DCF Signals A Very Different Story
While a 6.3x P/B hints at a rich price tag, the SWS DCF model presents a contrasting perspective. It estimates Nuvalent’s future cash flow value at about $566.34 per share compared with the current $100.28. This suggests the stock appears heavily undervalued within this framework. Which signal should carry more weight for you?
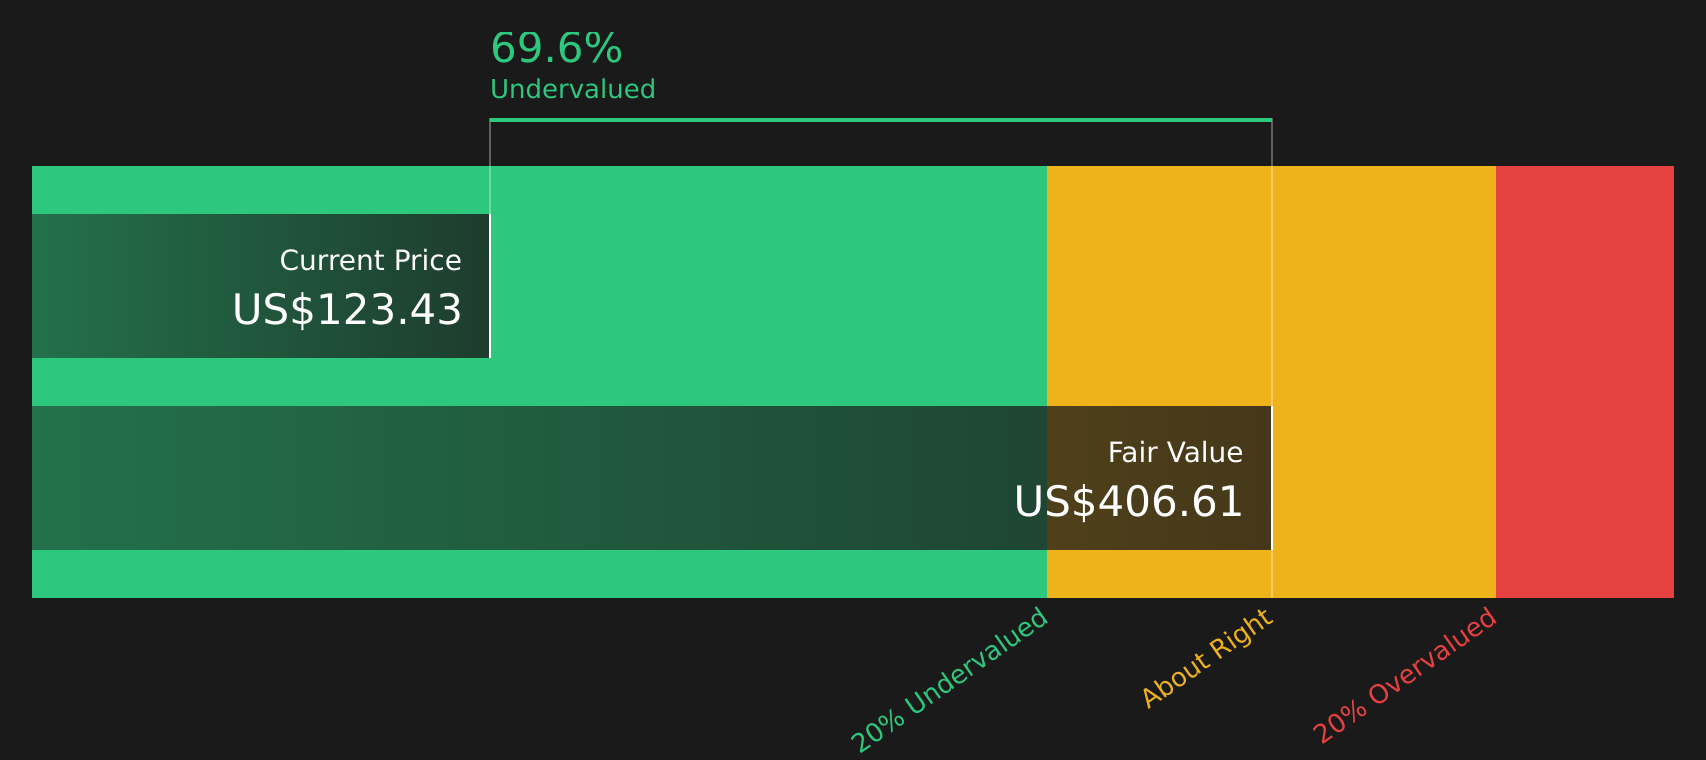
Simply Wall St performs a discounted cash flow (DCF) on every stock in the world every day (check out Nuvalent for example). We show the entire calculation in full. You can track the result in your watchlist or portfolio and be alerted when this changes, or use our stock screener to discover 51 high quality undervalued stocks. If you save a screener we even alert you when new companies match - so you never miss a potential opportunity.
Next Steps
With such mixed signals across valuation models and sentiment, this is a moment to look closely at the facts and form your own stance quickly while others hesitate, starting with a clear view of the 3 key rewards and 2 important warning signs.
Looking for more investment ideas?
If Nuvalent is on your radar, do not stop there. Fresh ideas from other corners of the market can sharpen your next move.
- Spot potential mispricings fast by checking companies that screen as 51 high quality undervalued stocks before others catch on.
- Prioritize resilience by reviewing 74 resilient stocks with low risk scores that may suit a steadier approach to portfolio building.
- Hunt for lesser known opportunities by scanning a screener containing 25 high quality undiscovered gems that many investors might still be overlooking.
This article by Simply Wall St is general in nature. We provide commentary based on historical data and analyst forecasts only using an unbiased methodology and our articles are not intended to be financial advice. It does not constitute a recommendation to buy or sell any stock, and does not take account of your objectives, or your financial situation. We aim to bring you long-term focused analysis driven by fundamental data. Note that our analysis may not factor in the latest price-sensitive company announcements or qualitative material. Simply Wall St has no position in any stocks mentioned.