Nvidia (NVDA) Stock Weighs AI Optimism Against Conflicting Valuation Signals
NVIDIA Corporation NVDA | 0.00 |
With NVIDIA stock on many watchlists, a key question for you is whether the current price reflects the value of its business or if expectations are running ahead of fundamentals.
The share price closed at US$212.45 most recently, with returns of 2.0% over the past week, a decline of 5.7% over the past month, a 12.5% gain year to date, and a 47.6% gain over the last year, alongside a very large 3 year and 5 year return.
Recent headlines around NVIDIA have centered on its position in semiconductors and AI related demand, as well as broader conversations about how much future growth is already reflected in the share price. These themes help explain why the stock can move quickly when sentiment around growth or risk shifts, even without company specific announcements.
On Simply Wall St's six point valuation framework, NVIDIA currently has a valuation score of 3/6. The next sections will break down what this means using methods like P/E multiples and discounted cash flow, before finishing with a broader way to think about valuation that goes beyond the numbers alone.
Approach 1: NVIDIA Discounted Cash Flow (DCF) Analysis
A Discounted Cash Flow, or DCF, model estimates what NVIDIA stock might be worth today by taking projected future cash flows and discounting them back into current dollars. It is essentially asking what those future cash flows are worth to you right now.
NVIDIA is estimated to have generated trailing twelve month Free Cash Flow of about US$119.4b. Using a 2 Stage Free Cash Flow to Equity model, analysts and extrapolations project Free Cash Flow reaching US$540.8b in 2035, with specific forecasts provided out to 2031 and later years extended by Simply Wall St. These figures are all in US$, which keeps the cash flow side consistent with the listed share price currency.
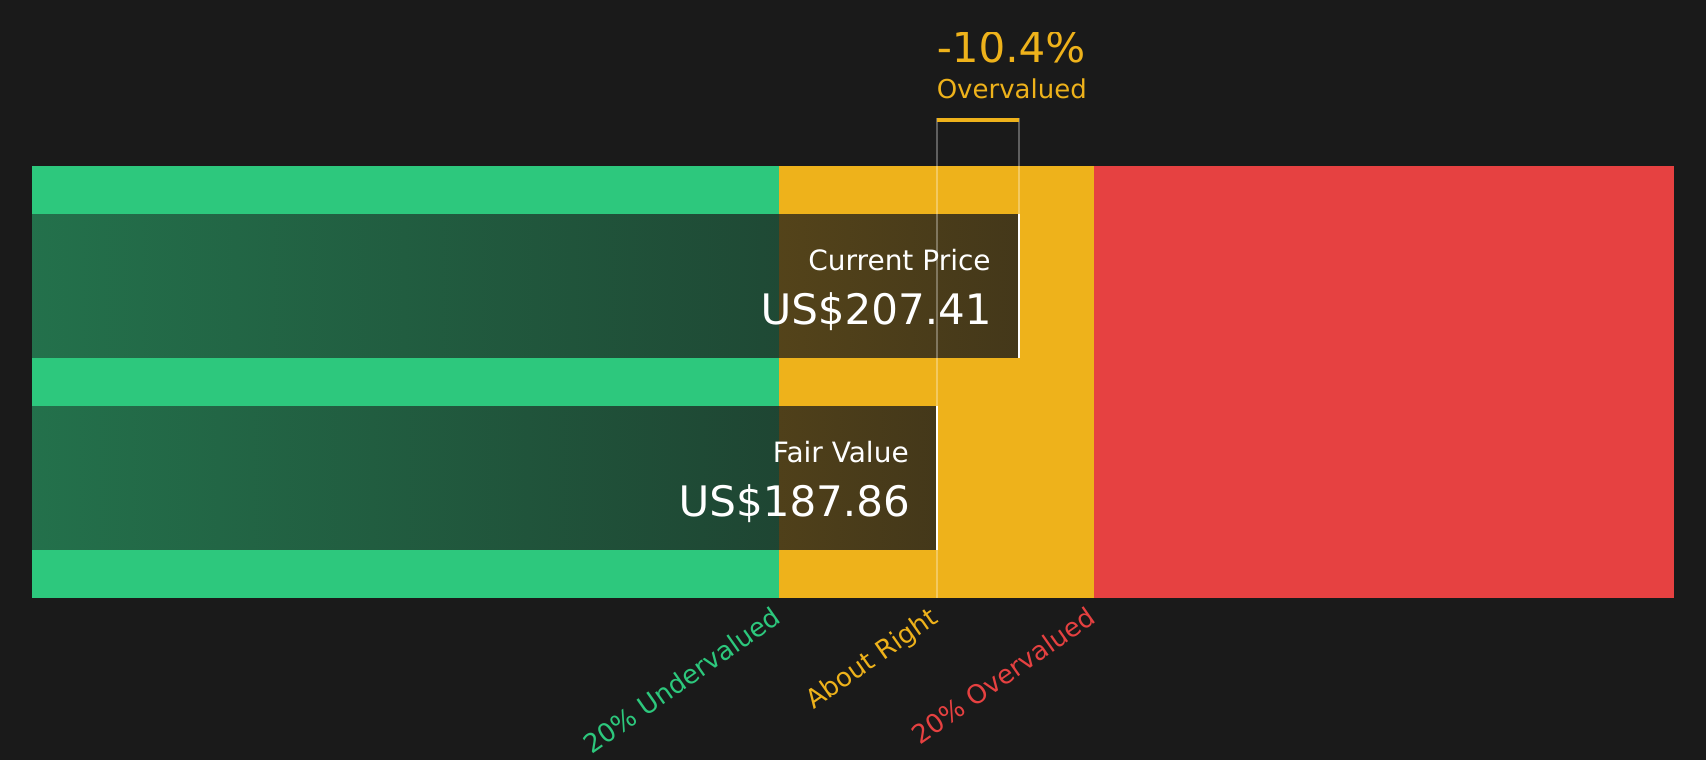
When all those projected cash flows are discounted back, the model arrives at an estimated intrinsic value of US$188.36 per share. Compared with the recent share price of US$212.45, the DCF output suggests NVIDIA is about 12.8% above this estimate, which points to the stock trading at a premium to this particular model.
Result: OVERVALUED
Our Discounted Cash Flow (DCF) analysis suggests NVIDIA may be overvalued by 12.8%. Discover 47 high quality undervalued stocks or create your own screener to find better value opportunities.
Approach 2: NVIDIA Price vs Earnings
For a profitable company like NVIDIA, the Price to Earnings, or P/E, ratio is a useful way to see how much you are paying for each dollar of current earnings. Higher growth expectations and lower perceived risk usually support a higher P/E, while slower expected growth or higher risk tend to be linked with a lower or more cautious P/E that many investors see as fair.
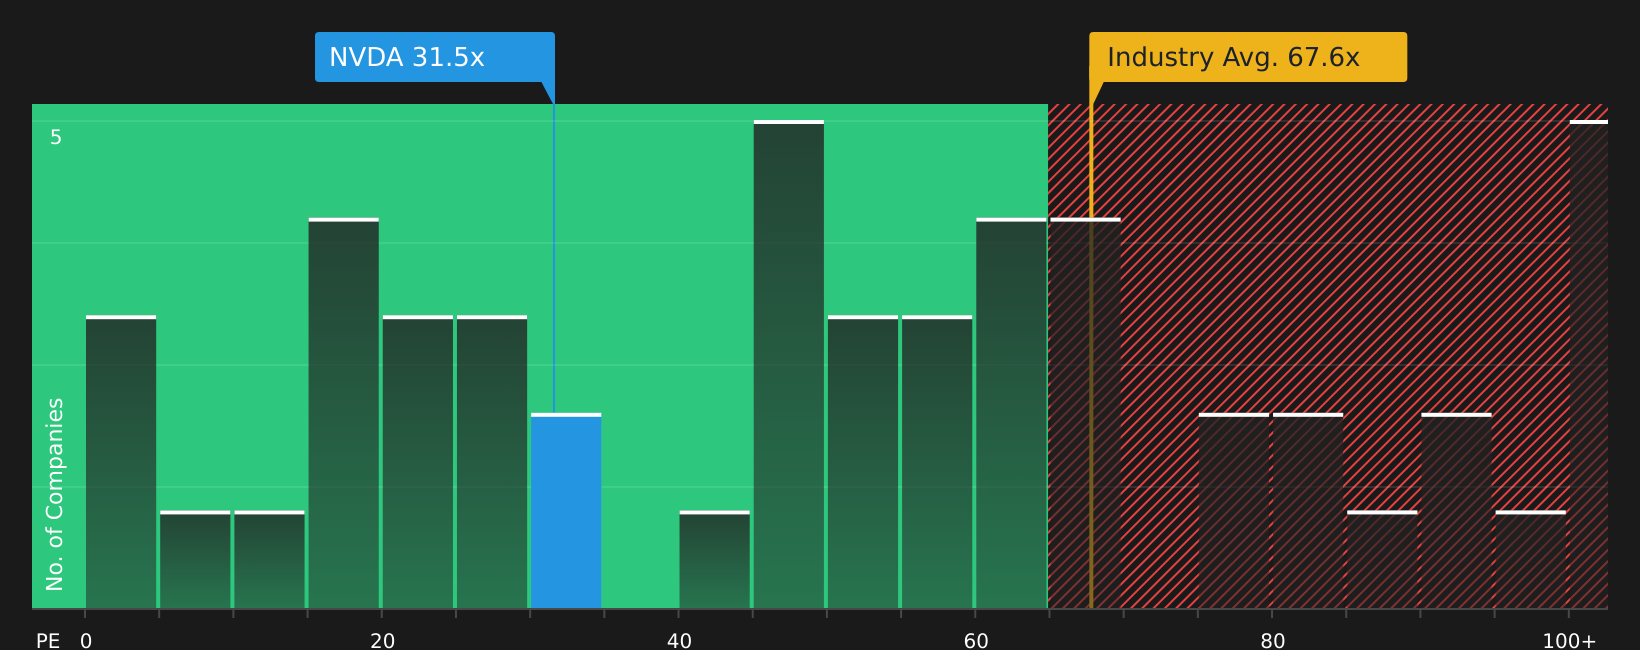
NVIDIA currently trades on a P/E of 32.24x. This sits below the semiconductor industry average P/E of 72.40x and below the peer average of 100.67x. On the surface, that indicates the stock trades at a lower multiple than many comparable semiconductor companies.
Simply Wall St's Fair Ratio framework goes a step further by estimating what P/E might be appropriate for NVIDIA given factors such as its earnings growth profile, profit margins, industry, market cap and risk characteristics. For NVIDIA, this Fair Ratio is 63.95x, which is materially higher than the current 32.24x P/E. That gap indicates the stock is pricing in less growth or carries a lower valuation than this framework suggests could be reasonable.
Result: UNDERVALUED
P/E ratios tell one story, but what if the real opportunity lies elsewhere? Start investing in legacies, not executives. Discover our 20 top founder-led companies.
Upgrade Your Decision Making: Choose your NVIDIA Narrative
Earlier we mentioned that there is an even better way to understand valuation, so this is where Narratives come in as a way to connect your view of NVIDIA stock with the numbers you see on screen.
A Narrative is simply your story about the company, linked directly to your own fair value estimate and assumptions for future revenue, earnings and margins, rather than relying only on a single model or headline ratio.
On Simply Wall St’s Community page, Narratives are set up as an easy tool so you can see how that story flows into a forecast and then into a fair value, and compare that fair value with today’s price to help you decide if NVIDIA looks attractive, expensive or somewhere in between on your terms.
Because Narratives on the platform update when new information appears, such as earnings reports or news about data center demand or export rules, your view is kept current without you rebuilding a model every time something changes.
The range of existing NVIDIA Narratives shows how different investors can look at the same stock and reach different conclusions, with fair values anywhere from about US$104 per share at the cautious end to more than US$345 per share at the optimistic end, giving you a concrete sense of how assumptions affect value.
For NVIDIA however we'll make it really easy for you with previews of two leading NVIDIA Narratives:
On Simply Wall St, 16 community members currently lean toward an undervalued view for NVIDIA and 9 lean toward an overvalued view, with 25 Narratives in total. Here is how one high conviction bull case and one bear case frame the same stock very differently.
Fair value: US$339.90 per share
Implied discount to this fair value: about 37.5% below the narrative fair value at the recent US$212.45 share price
Revenue growth assumption: 30%
- The author expects NVIDIA to reach US$400b in annual revenue within 5 years, with around 90% of that coming from data center customers buying high value GPU racks.
- This view relies on NVIDIA maintaining a strong position in GPU design and its AI software stack, while partners such as TSMC and ASML keep advancing manufacturing so data centers keep upgrading hardware.
- The narrative flags several risks around competitive chips, alternative AI platforms, data center power constraints and shifting energy and AI regulation that could limit how much of this opportunity actually converts into revenue.
Fair value: US$104.00 per share
Implied premium to this fair value: about 104.3% above the narrative fair value at the recent US$212.45 share price
Revenue growth assumption: 13%
- This author sees NVIDIA as having earned its reputation in AI training, thanks to the CUDA ecosystem and GPU architecture, but questions how long that advantage can support current expectations.
- The core concern is that AI training demand could settle after an initial build out, while a large part of inference work may shift toward custom chips, ASICs or more efficient CPUs instead of NVIDIA GPUs.
- Under this view, today’s price embeds very strong assumptions and the stock could reset to what the author sees as a more normal range, even if NVIDIA remains highly profitable and important for AI infrastructure.
These two NVIDIA Narratives frame the same business with very different revenue paths, margins, risk assessments and fair values, which is exactly the point of using Narratives. You can test which story lines up better with your own expectations for AI demand, competition and regulation, and then ground that view in numbers rather than headlines.
If you want to go a step further, you can also review how other investors are weighing risks and rewards and then build your own narrative and fair value range around NVIDIA stock using the same framework that underpins these examples. To see how these results tie into long-term growth, risks, and valuation, check out the full range of community narratives for NVIDIA on Simply Wall St. Add the company to your watchlist or portfolio so you'll be alerted when the story evolves.
Do you think there's more to the story for NVIDIA? Head over to our Community to see what others are saying!
This article by Simply Wall St is general in nature. We provide commentary based on historical data and analyst forecasts only using an unbiased methodology and our articles are not intended to be financial advice. It does not constitute a recommendation to buy or sell any stock, and does not take account of your objectives, or your financial situation. We aim to bring you long-term focused analysis driven by fundamental data. Note that our analysis may not factor in the latest price-sensitive company announcements or qualitative material. Simply Wall St has no position in any stocks mentioned.