Nvidia (NVDA) Valuation Check As Narratives Clash With Cautious Cash Flow Outlook
NVIDIA Corporation NVDA | 0.00 |
NVIDIA (NVDA) continues to draw attention after recent share price swings, with the stock down about 4.4% over the past day but higher over the past week, month and past 3 months.
That 4.4% one day drop sits against a stronger backdrop, with a 7 day share price return of 4.7%, a 30 day return of 13.3% and a year to date gain of 19.31%. The 1 year total shareholder return of 66.45% and very large 5 year total shareholder return suggest longer term momentum has been strong.
If you are looking for more ideas around AI infrastructure and related themes, this could be a good moment to scan the market for 42 AI infrastructure stocks
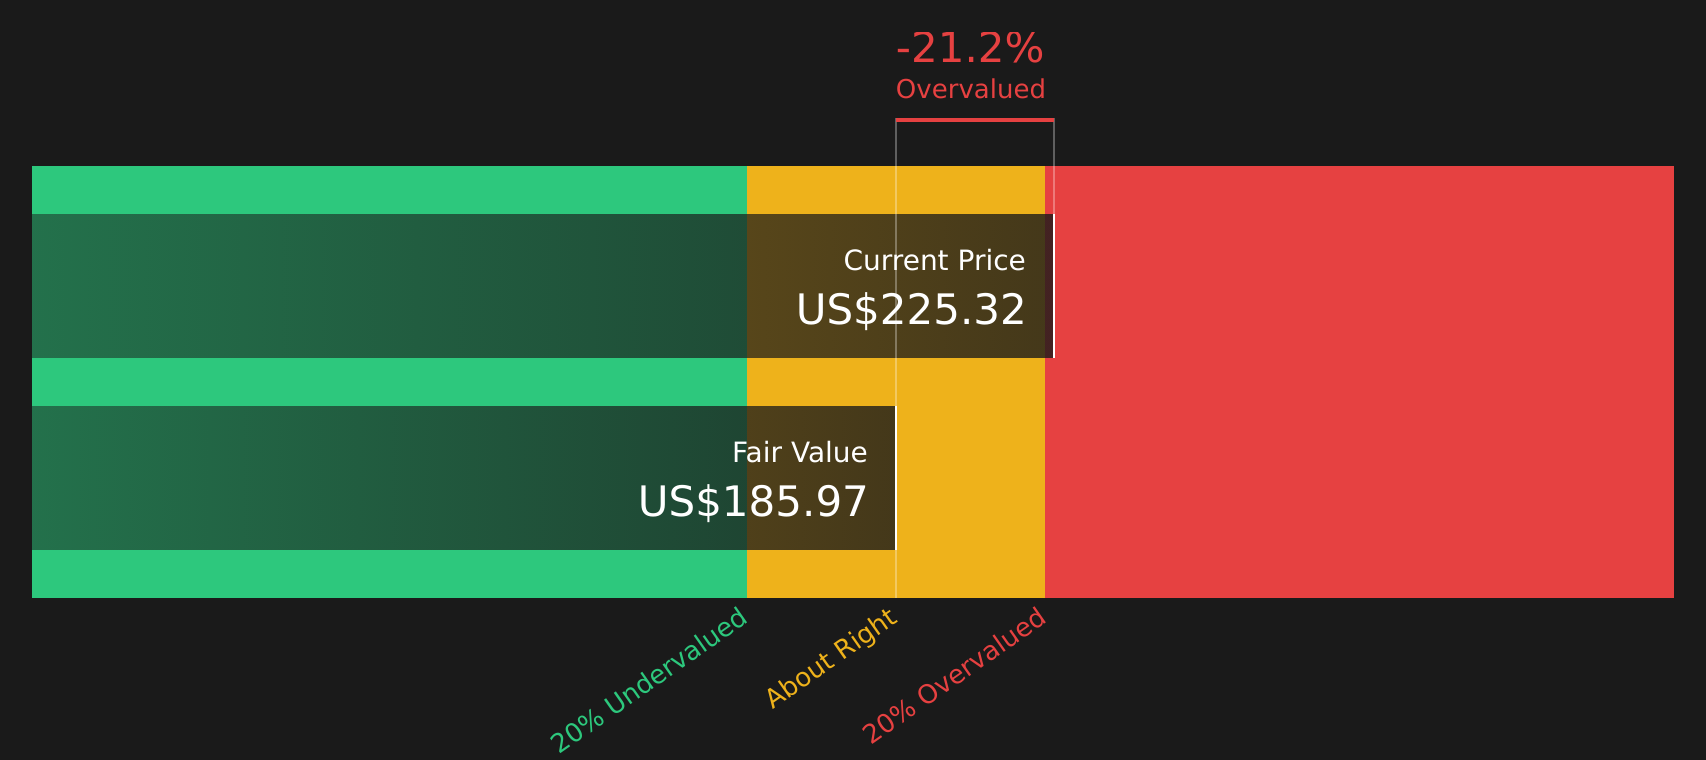
With NVIDIA now sitting at US$225.32 per share and trading at a discount of about 21% to the current analyst price target, the key question is whether this reflects undervaluation or if the market is already pricing in future growth.
Most Popular Narrative: 33.7% Undervalued
Compared with the last close at $225.32, the most followed narrative pegs NVIDIA's fair value at $339.90, which points to a sizeable valuation gap.
Nvidia will hit $400b annual revenue in 5 years time. ~90% of revenue will come from data centre customers. This equates to $90b / quarter, or equivalent to 30,000 Blackwell racks (at ~$3m per rack).
Curious what revenue mix, margins and future profit multiple sit behind that fair value? The narrative ties them together in a very specific way. See how the pieces fit.
According to KiwiInvest, this view also leans on long term earnings power and the valuation assigned to those earnings, rather than short term price moves.
Result: Fair Value of $339.90 (UNDERVALUED)
However, this depends on Nvidia maintaining its AI software advantage and avoiding heavy regulation that could limit data center growth or restrict key customers.
Another View: Cash Flows Paint A Different Picture
While the popular narrative points to NVIDIA being 33.7% undervalued at a fair value of $339.90, the SWS DCF model comes out more cautious, with an estimate of $185.62 per share. On that cash flow view, the stock screens as overvalued instead.
For investors, that kind of gap between earnings based narratives and cash flow based valuation raises a simple question: which lens do you trust more when expectations are this high? Look into how the SWS DCF model arrives at its fair value.
Simply Wall St performs a discounted cash flow (DCF) on every stock in the world every day (check out NVIDIA for example). We show the entire calculation in full. You can track the result in your watchlist or portfolio and be alerted when this changes, or use our stock screener to discover 50 high quality undervalued stocks. If you save a screener we even alert you when new companies match - so you never miss a potential opportunity.
Next Steps
With such different signals on value and expectations, it can help to check the underlying numbers yourself and weigh both the concerns and the upside potential. To get a quick sense of what the market is worried about and what it is excited about, start with 4 key rewards and 2 important warning signs.
Looking for more investment ideas?
If you stop at a single stock, you miss out on other opportunities that could fit your style better, so keep scanning for ideas that truly match your goals.
- Target potential mispricing by checking 50 high quality undervalued stocks that combine quality fundamentals with room for market expectations to catch up.
- Strengthen your core holdings by reviewing the solid balance sheet and fundamentals stocks screener (45 results) and focus on businesses with financial structures you can feel comfortable holding through swings.
- Use the screener containing 22 high quality undiscovered gems to find companies that may attract wider attention over time.
This article by Simply Wall St is general in nature. We provide commentary based on historical data and analyst forecasts only using an unbiased methodology and our articles are not intended to be financial advice. It does not constitute a recommendation to buy or sell any stock, and does not take account of your objectives, or your financial situation. We aim to bring you long-term focused analysis driven by fundamental data. Note that our analysis may not factor in the latest price-sensitive company announcements or qualitative material. Simply Wall St has no position in any stocks mentioned.