

Reassessing Manchester United (MANU) Valuation After Recent Share Price Momentum And Mixed Signals On Fair Value
Manchester United Plc Class A MANU | 0.00 |
Manchester United (MANU) shares have moved in recent weeks, with a return of about 6% over the past month and a decline of roughly 9% over the past 3 months catching investor attention.
At a share price of $16.82, Manchester United’s recent 6.05% 1 month share price return and 6.59% year to date share price return contrast with a weaker 3 year total shareholder return of 26.58% decline, suggesting recent momentum has picked up after a tougher period for longer term holders.
If this shift in sentiment has you thinking beyond a single club’s stock, it could be a good time to broaden your watchlist with fast growing stocks with high insider ownership.
With Manchester United trading at $16.82 and sitting at a discount to one published price target and an estimated intrinsic value, the key question is whether this is a buying opportunity or if the market is already pricing in future growth.
Price to Sales of 3.3x: Is it justified?
Manchester United is trading on a P/S of 3.3x, compared with a peer average of 2x and a US Entertainment industry average of 1.4x, so the shares look expensive on this yardstick despite sitting below one published price target and our own fair value estimate.
P/S compares the company’s share price with its revenue, which makes it a useful cross check for a club like Manchester United that is currently loss making but generates meaningful sales from broadcasting, matchday income and commercial activities.
At 3.3x sales, investors are paying a premium to both the peer group and the estimated fair P/S of 2.1x. This suggests the market is assigning a higher value to each dollar of revenue than our regression based fair ratio implies and that expectations for future progress are already partially reflected in the price.
The gap versus the US Entertainment sector is wide. Even against closer peers, the current P/S stands well above both average trading levels and the 2.1x level our model points to as a potential anchor the valuation could move toward over time.
Result: Price to Sales of 3.3x (OVERVALUED)
However, there are clear risks here, including ongoing losses of $40.992m and the possibility that sector wide sentiment toward media and sports assets will cool.
Another View on Value
While the P/S of 3.3x makes Manchester United look expensive against peers and the fair ratio of 2.1x, our DCF model points the other way. With the current price of $16.82 sitting about 21.5% below an estimated fair value of $21.43, the stock currently appears undervalued based on this model. This presents two different perspectives: one from the price-to-sales chart and one from the cash flow analysis.
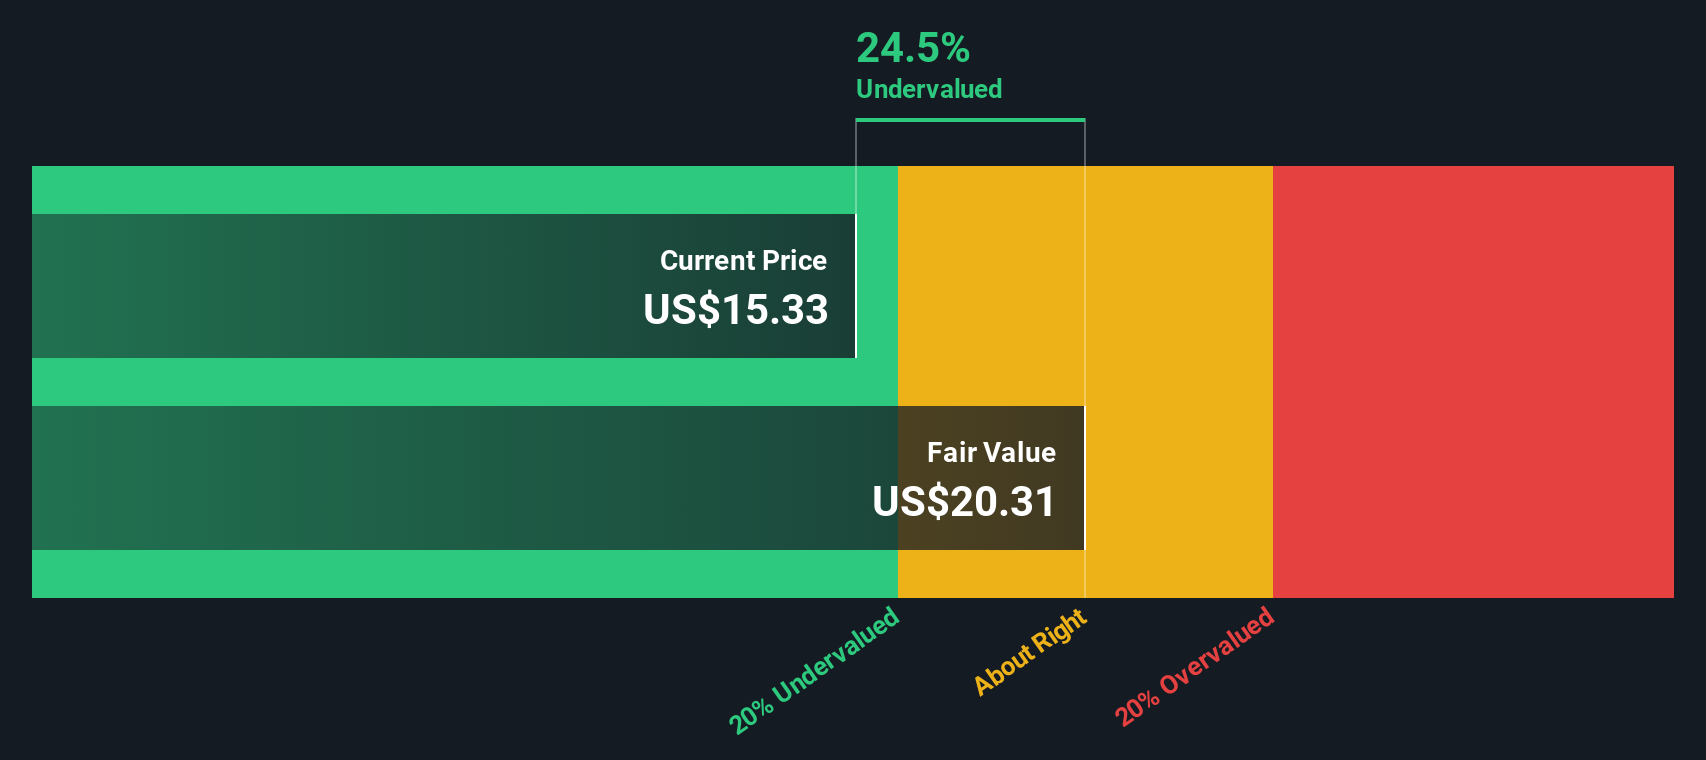
Simply Wall St performs a discounted cash flow (DCF) on every stock in the world every day (check out Manchester United for example). We show the entire calculation in full. You can track the result in your watchlist or portfolio and be alerted when this changes, or use our stock screener to discover 875 undervalued stocks based on their cash flows. If you save a screener we even alert you when new companies match - so you never miss a potential opportunity.
Build Your Own Manchester United Narrative
If you see the numbers differently or prefer to stress test the assumptions yourself, you can build and share your own view in a few minutes by starting with Do it your way.
A great starting point for your Manchester United research is our analysis highlighting 3 key rewards and 1 important warning sign that could impact your investment decision.
Looking for more investment ideas beyond Manchester United?
If you stop at just one stock, you could miss other opportunities that better match your goals, so use the rest of your research time to scan widely.
- Spot potential value plays early by zeroing in on these 875 undervalued stocks based on cash flows that may offer more for every dollar you put to work.
- Target income focused opportunities by checking out these 12 dividend stocks with yields > 3% that might suit a portfolio built around regular cash returns.
- Lean into the growth story in digital assets by reviewing these 20 cryptocurrency and blockchain stocks shaping payments, infrastructure, and blockchain related services.
This article by Simply Wall St is general in nature. We provide commentary based on historical data and analyst forecasts only using an unbiased methodology and our articles are not intended to be financial advice. It does not constitute a recommendation to buy or sell any stock, and does not take account of your objectives, or your financial situation. We aim to bring you long-term focused analysis driven by fundamental data. Note that our analysis may not factor in the latest price-sensitive company announcements or qualitative material. Simply Wall St has no position in any stocks mentioned.