

Saudi Weekly Heatmap | Industry Strength & Momentum Rotation · Market Positioning · Hot-Sector Logic (As of Aug 25)
BAHRI 4030.SA | 0.00 | |
SISCO HOLDING 2190.SA | 0.00 | |
FIPCO 2180.SA | 0.00 | |
SPM 2300.SA | 0.00 | |
OASIS 3007.SA | 0.00 |
Markets trade on rotation, not direction alone.
In this issue we read Tadawul's market temperature, rank the industries with the strongest one-week momentum, and map where the tape is accelerating, cooling off, or quietly bottoming out.
Subscribe to The Trend Catcher Topic / The Value Anchor Topic —unlock the full historical archive and never miss a weekly pick again.
1. Market Position — where the tape sits
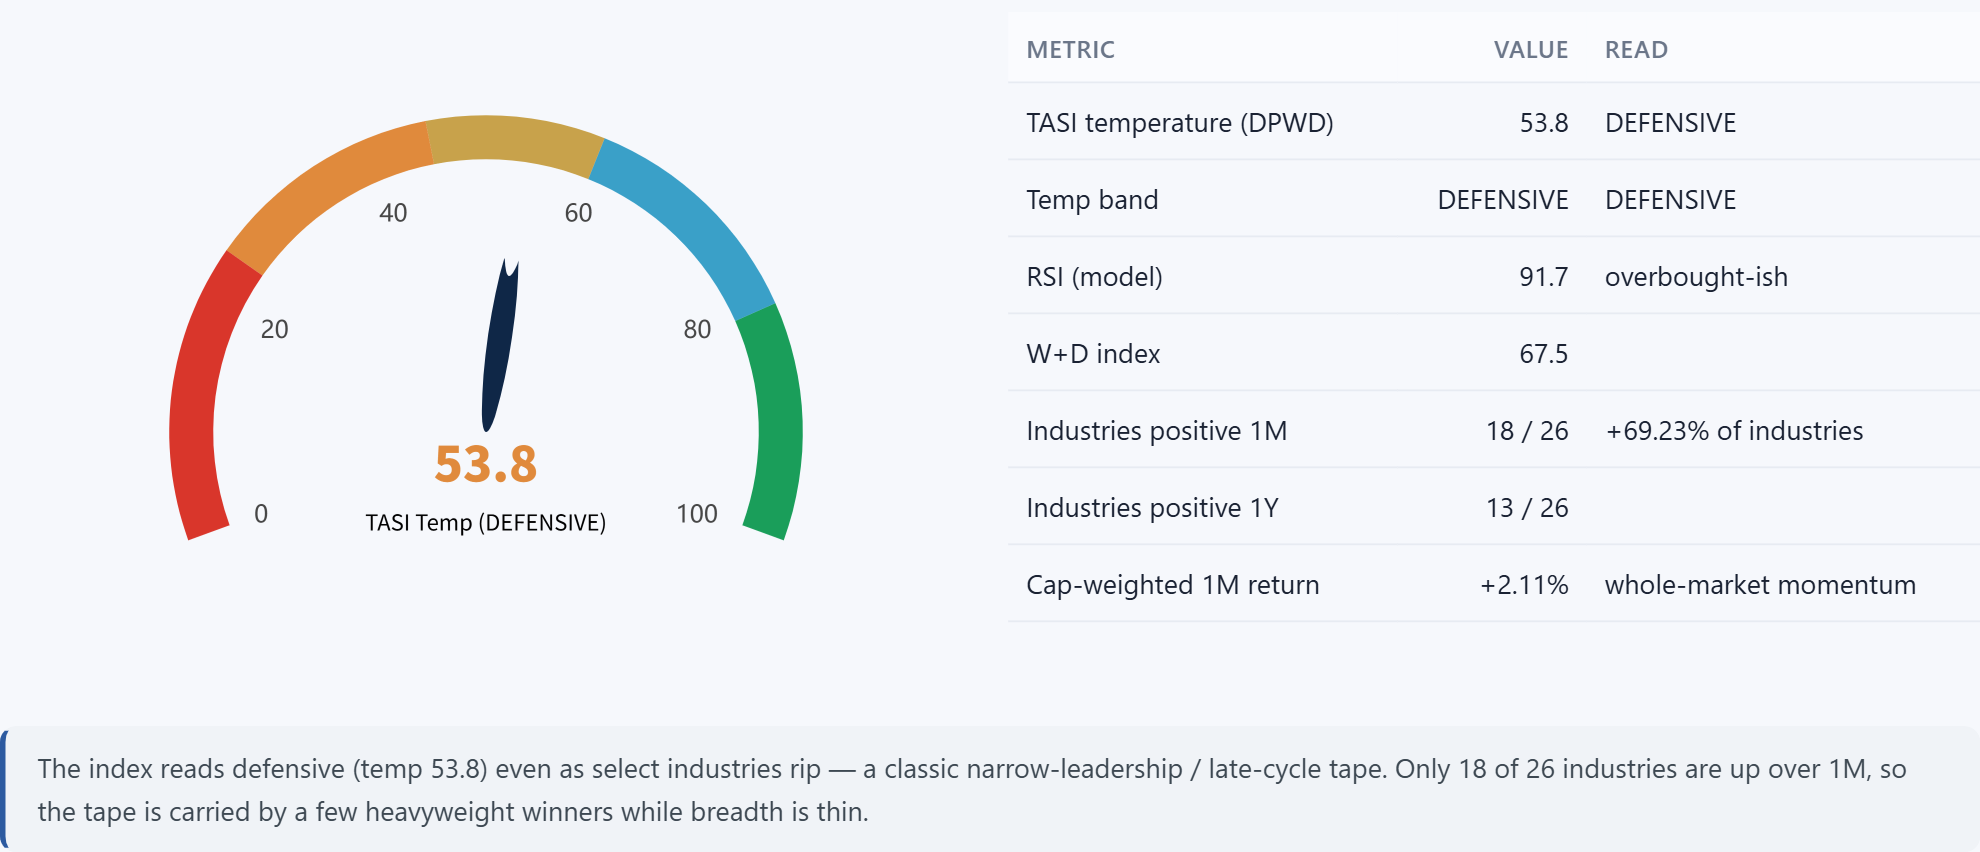
TASI temperature (DPWD model) plus breadth and cap-weighted momentum across all industries.
2. Sector Strength — Top Movers (Weekly view)
Top 10 industries ranked by 1-week relative strength (RPS1W) — the weekly leadership board. The 1W column shows a heat bar of the cap-weighted 1-week return (green = up, red = down); the RPS cells show relative price strength across six timeframes — green = strong, amber = mid, red = weak. Leader stocks are the top 1-week gainers driving each industry.
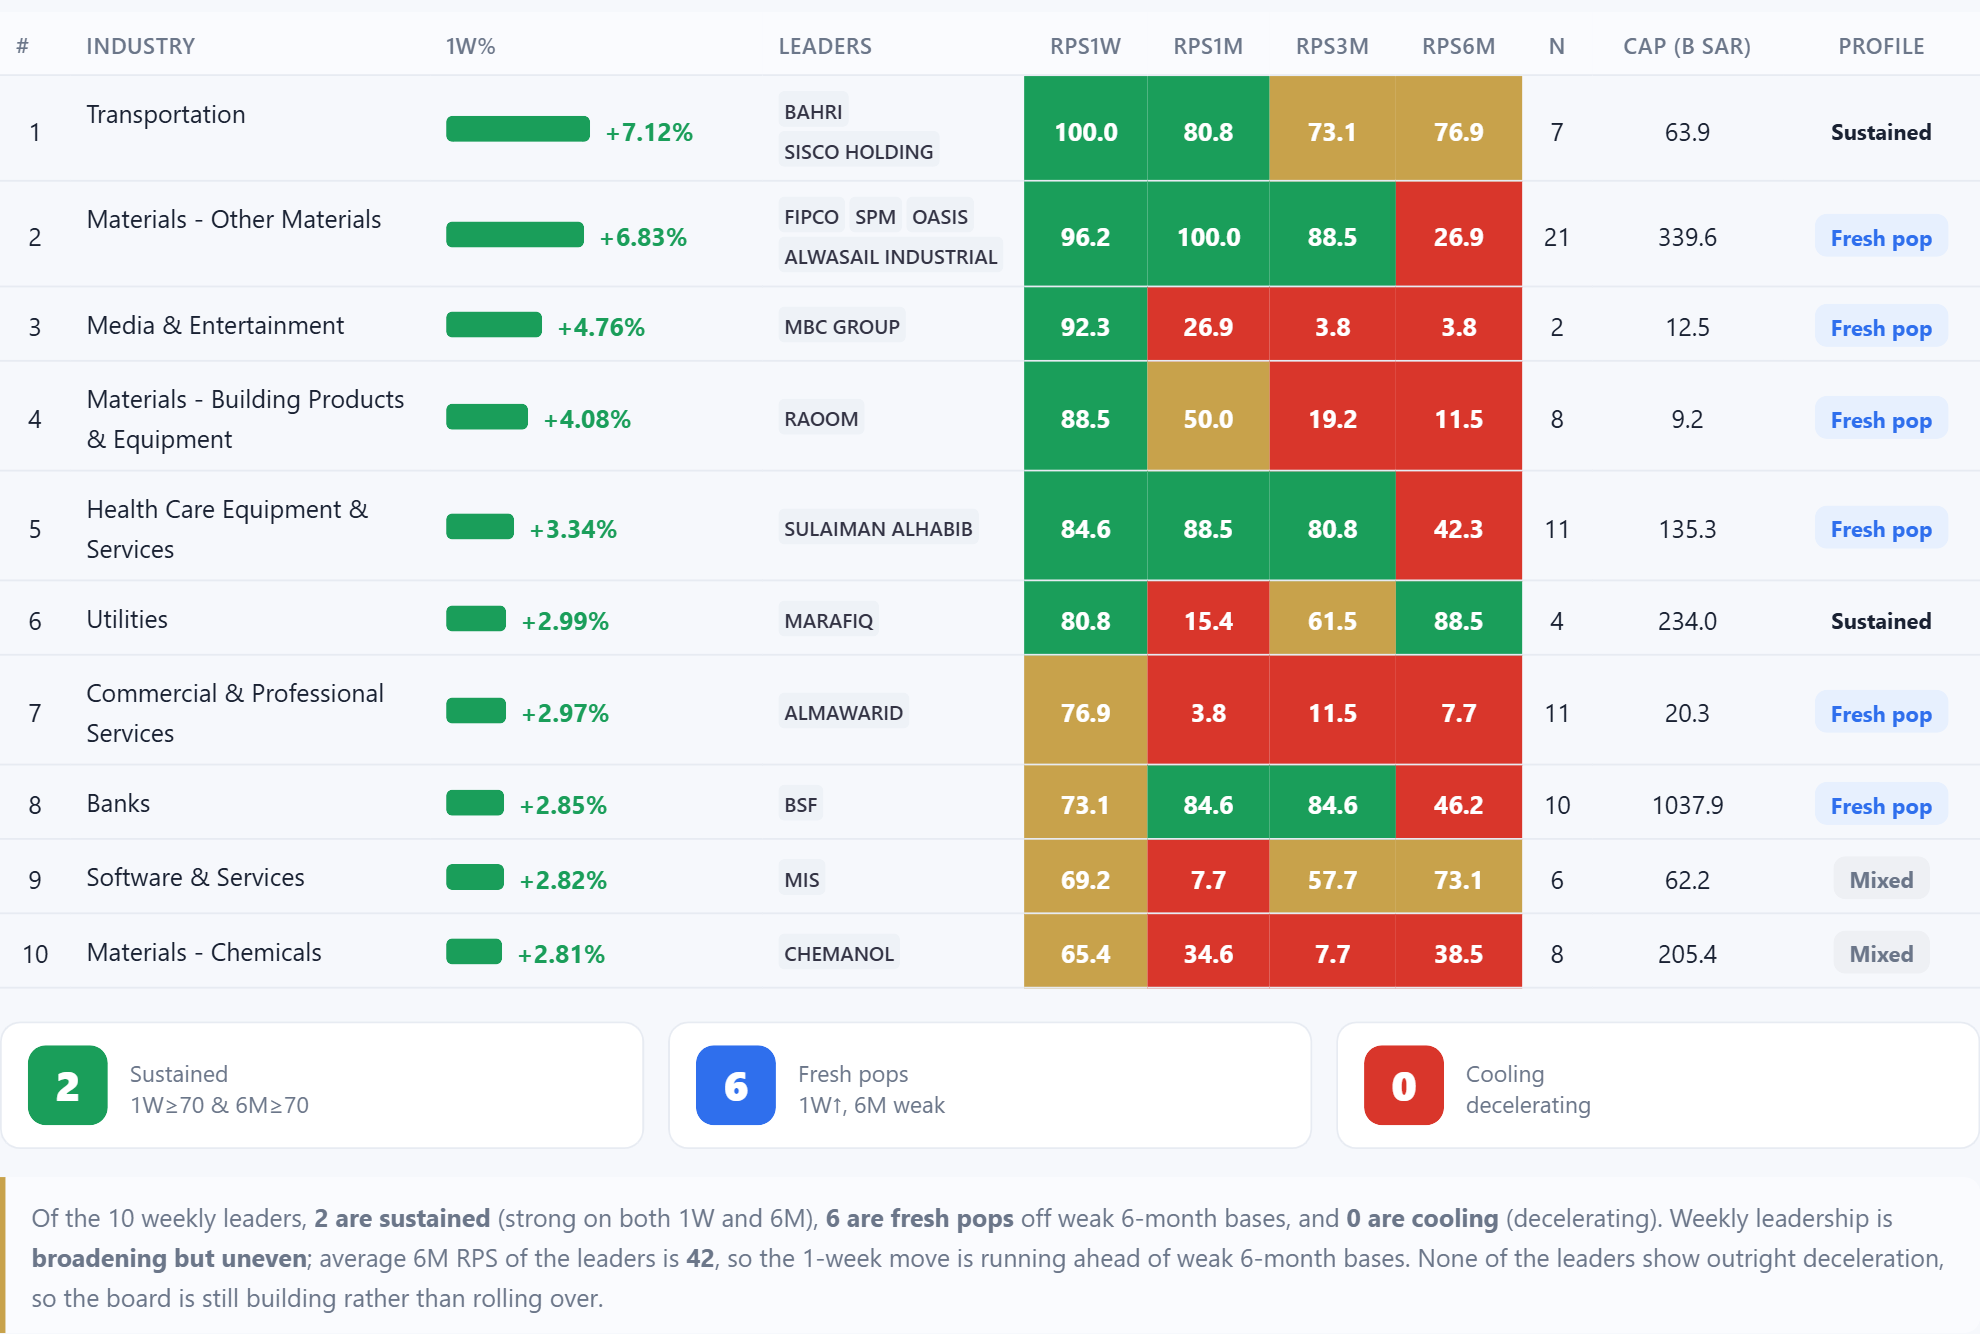
Related stocks: National Shipping Company of Saudi Arabia(4030.SA) , Sustained Infrastructure Holding Co.(2190.SA) , Filing and Packing Materials Manufacturing Co.(2180.SA) , Saudi Paper Manufacturing Co.(2300.SA) , Zahrat Al Waha for Trading Co.(3007.SA) , Alwasail Industrial Co.(4148.SA) , MBC Group Co.(4072.SA) , Raoom Trading Co.(4144.SA) , Dr. Sulaiman Al Habib Medical Services Group(4013.SA) , The Power and Water Utility Company for Jubail and Yanbu(2083.SA) , Al Mawarid Manpower Co.(1833.SA) , Banque Saudi Fransi(1050.SA) , Al Moammar Information Systems Co.(7200.SA) , Methanol Chemicals Co.(2001.SA)
3. Rotation Map — dynamic changes
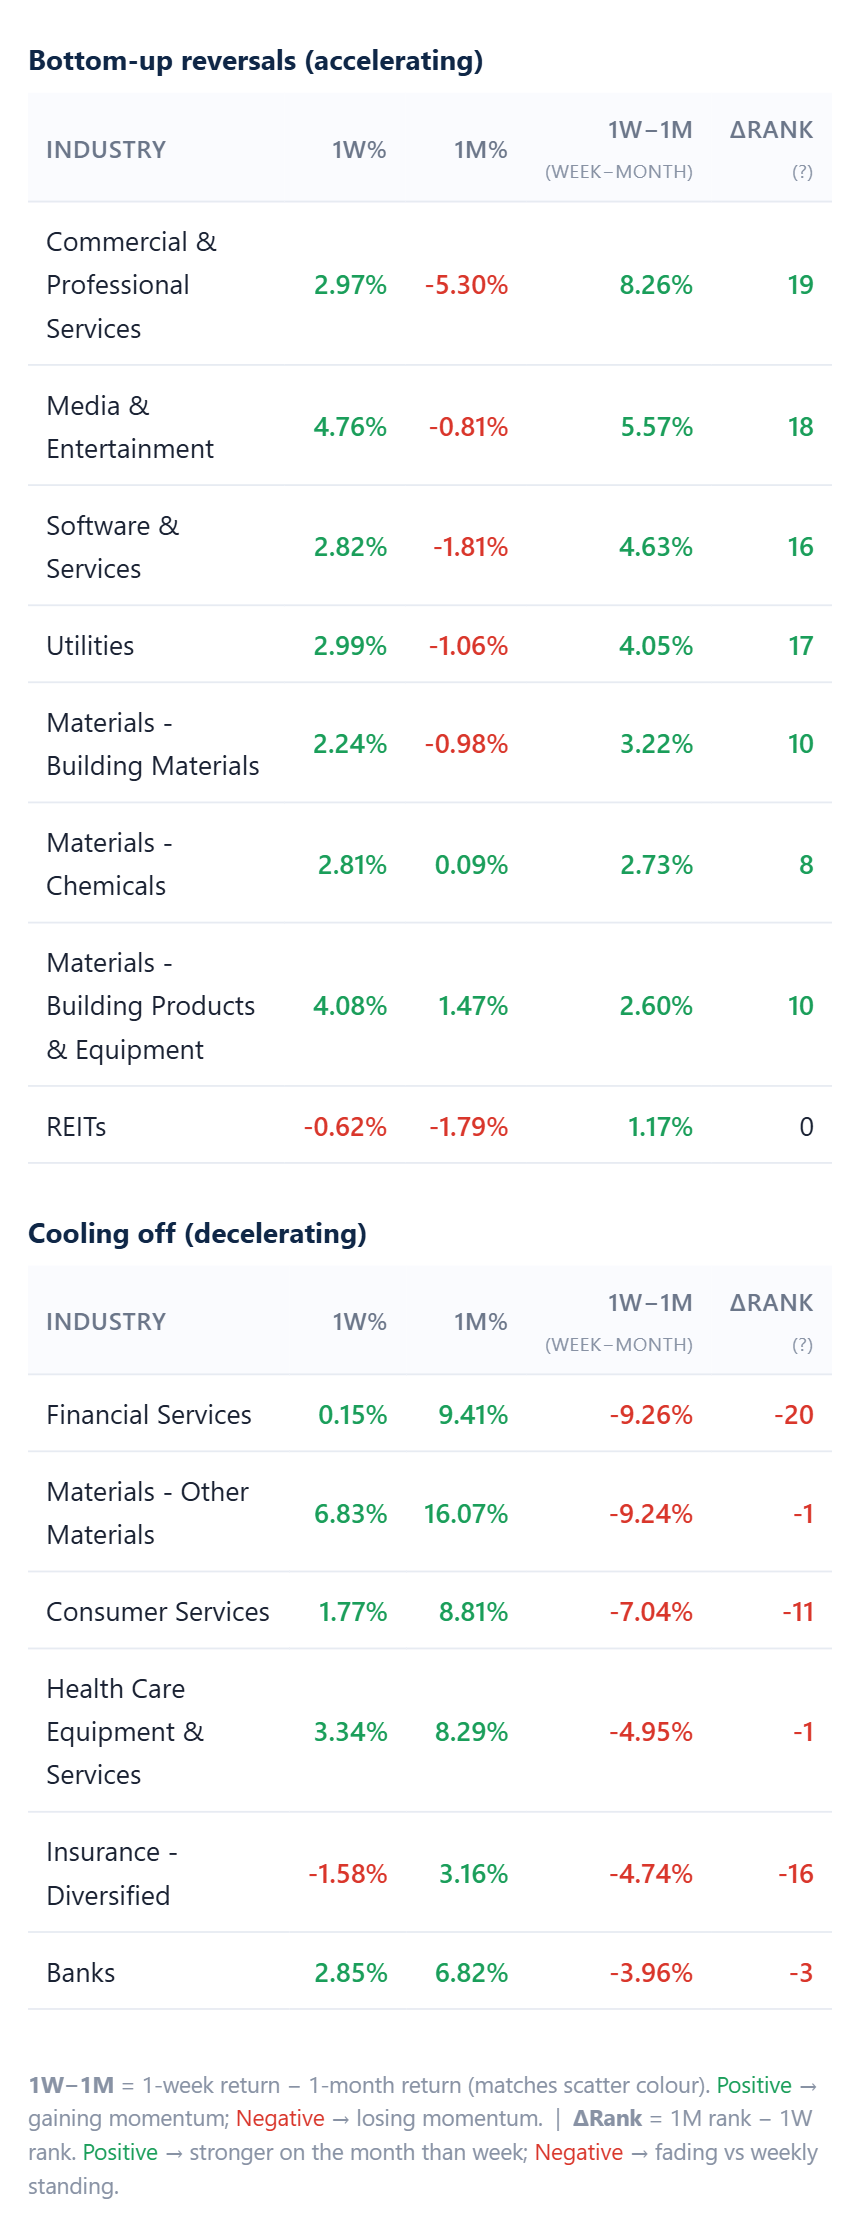
This map answers a different question from Section 2: not who is strong in absolute terms, but is each industry's momentum accelerating or decelerating? Each bubble plots an industry's 1‑week return (X) against its 1‑month return (Y). Bubbles below the y = x diagonal are warming — weekly strength is building on the monthly trend (or declines are slowing, signalling potential bottoming / early rebound). Bubbles above the diagonal are cooling — short‑term momentum is fading relative to the month. An industry can sit in the lower half with a negative 1‑week return yet still be warming if its drop is far milder than the monthly loss — that deceleration itself is a constructive signal.
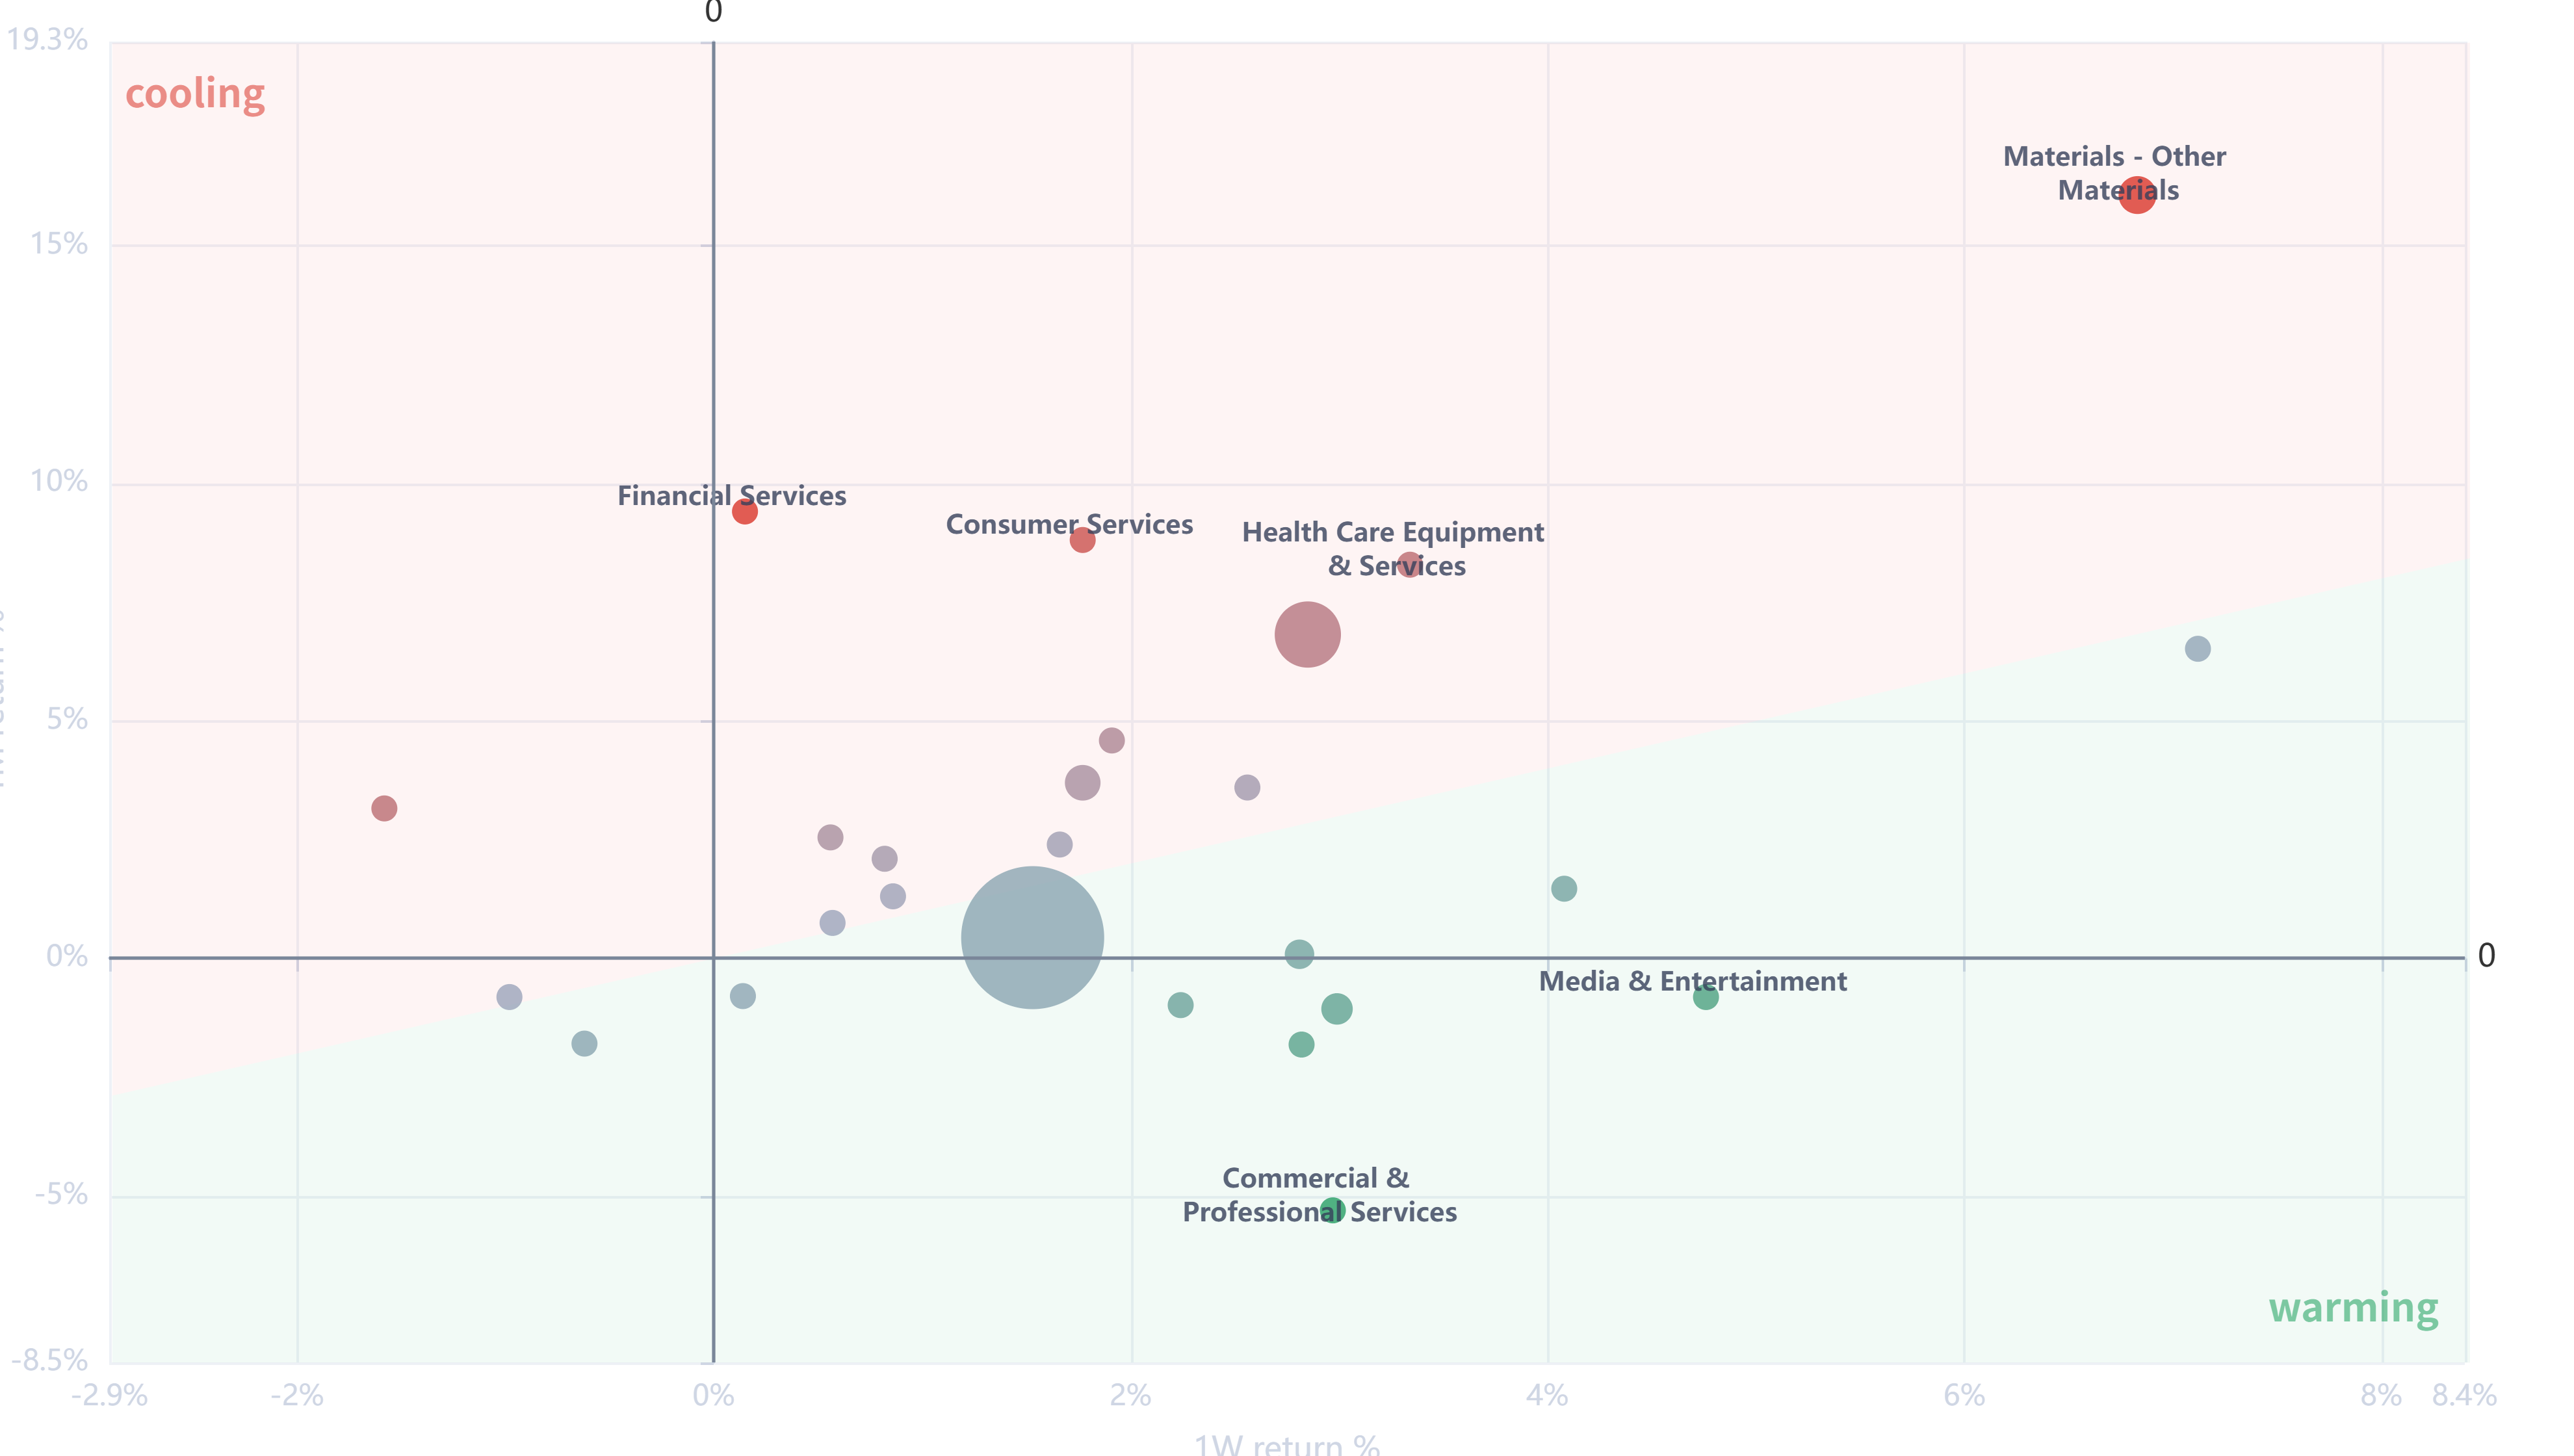
Technical reference. Axes: X = cap-weighted 1-week return (%); Y = cap-weighted 1-month return (%); bubble size = total market cap; bubble colour = acceleration spread (1W - 1M). Four lines divide the plane: x-axis (1W = 0), y-axis (1M = 0), the solid y = x diagonal (thermal boundary), and a dashed y = -x anti-diagonal. Background tints mark cooling (upper half-plane) vs warming (lower half-plane). Colour scale: green = accelerating (1W outpacing 1M); red = decelerating (1M outpacing 1W); grey ~ neutral. Quadrant shorthand: top-right = sustained strength; top-left = rolling over (firm month, soft week); bottom-left = broad weakness; bottom-right = rebounding off weak month.
4. Hot-Sector Logic — what drives the moves
